NORDSON CORPORATION
Notice of
20162019 Annual Meeting
and Proxy Statement


SCHEDULE 14A
(Rule 14a-101)
INFORMATION REQUIRED IN PROXY STATEMENT
SCHEDULE 14A INFORMATION
Proxy Statement Pursuant to Section 14(a) of the
Securities Exchange Act of 1934
Filed by the Registrant x☒ Filed by a Party other than the Registrant ¨☐
Check the appropriate box:
| Preliminary Proxy Statement | ||||
| Confidential, for Use of the Commission Only (as permitted by Rule 14a-6(e)(2)) | ||||
| Definitive Proxy Statement | ||||
| Definitive Additional Materials | ||||
| Soliciting Material Pursuant Rule 14a-12 | ||||
NORDSON CORPORATION | ||||
| (Name of Registrant as Specified in Its Charter) | ||||
| (Name of Person(s) Filing Proxy Statement, if other than the Registrant) | ||||
| Payment of Filing Fee (Check the appropriate box): | ||||
| No fee required. | ||||
| Fee computed on table below per Exchange Act Rules 14a-6(i)(1) and 0-11. | ||||
| (1) | Title of each class of securities to which transaction applies:
Not Applicable | |||
| ||||
| (2) | Aggregate number of securities to which transaction applies:
Not Applicable | |||
| ||||
| (3) | Per unit price or other underlying value of transaction computed pursuant to Exchange Act Rule 0-11 (Set forth the amount on which the filing fee is calculated and state how it was determined):
Not Applicable | |||
| ||||
| (4) | Proposed maximum aggregate value of transaction:
Not Applicable | |||
| ||||
| (5) | Total fee paid: | |||
| Not Applicable | ||||
| ||||
| Fee paid previously with preliminary materials. | ||||
| Check box if any part of the fee is offset as provided by Exchange Act Rule 0-11(a)(2) and identify the filing for which the offsetting fee was paid previously. Identify the previous filing by registration statement number, or the Form or Schedule and the date of its filing. | ||||
| (1) | Amount Previously Paid:
Not Applicable | |||
| ||||
| (2) | Form, Schedule or Registration Statement No.:
Not Applicable | |||
| ||||
| (3) | Filing Party:
Not Applicable | |||
| ||||
| (4) | Date Filed:
Not Applicable | |||
| ||||
NORDSON CORPORATION
Notice of
20162019 Annual Meeting
and Proxy Statement


Nordson Corporation
28601 Clemens Road
Westlake, Ohio 44145
January 29, 201618, 2019
It is my pleasure, on behalf of the Board of Directors of Nordson Corporation (the “Board of Directors”), to invite you to attend our annual meeting of shareholders (the “Annual Meeting”), which will be held at the law offices of Squire Patton Boggs (US)BakerHostetler LLP, 49002000 Key Tower, 127 Public Square, Cleveland, Ohio 44114, at 8:00 a.m., eastern standard time,Eastern Time, on Tuesday, March 1, 2016.February 26, 2019.
The accompanying notice of Annual Meeting and proxy statementProxy Statement describe the items of business that will be discussed and voted upon during the Annual Meeting. It is important that you vote your shares of common stock whether or not you plan to attend the Annual Meeting. You have a choice of voting through the Internet, by telephone, or by returning the enclosed proxy/voting instruction card by mail. If you are a registered shareholder, you may also vote in person at the Annual Meeting. Please refer to the instructions in the enclosed materials.
On behalf of management and the Board of Directors, I want to thank you for your continued support and confidence in 2016.2019.
Sincerely,
JOSEPH P. KEITHLEYMICHAEL J. MERRIMAN, JR.
ChairmanChair of the Board of Directors
NORDSON CORPORATION
NOTICE OF ANNUAL MEETING
OF SHAREHOLDERS
To Be Held Tuesday, March 1, 2016February 26, 2019
Date and Time: | Tuesday, | |
Place: | ||
Items of Business: | 1. To elect as directors, three nominees named in this Proxy Statement and recommended by the Board of Directors, to serve until the 2. To ratify the appointment of Ernst & Young LLP as our independent registered public accounting firm for the fiscal year ending October 31, 3. To approve, on an advisory basis, the compensation of our named executive officers; and 4. To transact | |
Record Date: | Close of business on January |
A Proxy Statement, Proxy/Voting Instruction Card, and Annual Report to Shareholders, which includes our Annual Report on Form10-K for the fiscal year ended October 31, 2015,2018, accompany this noticeNotice and are also available at:www.nordson.com/en/our-company/investors/annual-reports-and-presentations. The Board of Directors has determined that our shareholders of record at the close of business on January 4, 20162, 2019 are entitled to notice of, and to vote at,during, the Annual Meeting.
By Order of the Board of Directors,
ROBERT E. VEILLETTEGINA A. BEREDO
Executive Vice President, General Counsel
and Secretary
January 29, 201618, 2019
Westlake, Ohio
Important Notice Regarding the Availability of Proxy Materials for the Annual
Meeting of Shareholders to be held on March 1, 2016:February 26, 2019:
The Proxy Statement, Proxy/Voting Instruction Card, and the Annual Report to Shareholders, which includes our Annual Report onForm 10-K for the fiscal year ended October 31, 2015,2018, are available at:www.nordson.com/en/our-company/investors/annual-reports-and-presentationsannual-reports-and-presentations..
Nordson Corporation – | | 1 |
This summary highlights information relating to the items to be voted on atduring the Annual Meeting and important business, compensation, and corporate governance matters. For additional information, please refer to the discussions contained in this Proxy Statement and in our Annual Report onForm 10-K for the fiscal year ended October 31, 20152018 filed with the United States (U.S.) Securities and Exchange Commission on December 15, 201514, 2018 (the “2015“2018 Annual Report”).
| ||
| Tuesday, February 26, 2019 8:00 a.m.,
| |
Place |
Law Offices of BakerHostetler LLP
127 Public Square Cleveland, Ohio 44114 USA | |
| ||
Record Date | Close of business on January | |
Voting | Shareholders as of the record date are entitled to vote. Each share of common stock is entitled to one vote for the election of directors and one vote for each of the proposals to be voted on. | |
| ||||||||
| Voting Options | Required Vote | Broker Discretionary Vote Permitted | Board’s Voting Recommendation | |||||
1. Election of
| “FOR” all nominees or “WITHHOLD” your vote for one or more of the nominees. | Each nominee must receive a plurality of the votes cast. | No | FOR the election of each of the director nominees | ||||
2. Ratify the appointment of Ernst & Young LLP as | ||||||||
| 2019
| “FOR” or “AGAINST” or “ABSTAIN” from voting. | Thisnon-binding proposal will be considered approved if more votes are cast in favor than against. | Yes(1) | FOR | ||||
3. Advisory vote to approve compensation of named executive officers | “FOR” or “AGAINST” or “ABSTAIN” from voting. | Thisnon-binding proposal will be considered approved if more votes are cast in favor than against. | No | FOR | ||||
| (1) | This is considered to be a routine matter and, therefore, if you hold your shares in street name and do not provide voting instructions to the broker, trustee, or other nominee that holds your shares, the nominee has discretionary authority to vote on this Proposal but not any other Proposals since they are considered to be“non-routine” matters. |
Abstentions as to any matter are counted in determining the presence of a quorum at the Annual Meeting. They are not included in the vote count for election of directors. However, abstentions will affect the outcome of the vote on Proposals 2 and 3, being equivalent to a vote “against” the Proposals.
| 2 | | Nordson Corporation – |
We will also consider any other matters that may properly be brought before the Annual Meeting and any postponement(s) or
adjournment(s) thereof. As of the date of this Proxy Statement, we have not received notice of other matters that may be properly presented at the Annual Meeting.
The following table provides summary information about our director nominees:
Nominee
| Age
| Director Since
| Primary
| Independent
| Board Memberships
| Key Attributes/
| ||||||
Lee C. Banks | 52 | 2010 | President and Chief Operating Officer, Parker Hannifin Corporation | Yes | Compensation | Significant executive general management and operational experiences and a unique perspective in identifying strategic and tactical risks attendant to a multi-national sales, distribution, manufacturing and operational footprint.
| ||||||
Randolph W. Carson | 64 | 2009 | Retired | Yes | Audit and Governance & Nominating | Deep operational experience in global industrial businesses, strategic vision and understanding of financial accounting and financial matters; public company board experience.
| ||||||
Victor L. Richey, Jr. | 58 | 2010 | Chairman | Yes | Compensation and Governance & Nominating | Extensive experience as chairman, president and chief executive officer of a diversified global producer and marketer of technology; significant executive management and board experience at public and private companies.
|
Fiscal year 2015 was a year of solid financial and operating results in an uncertain and low-growth global macroeconomic environment, one that was affected profoundly by a strong U.S. Dollar. The following table represents key financial measures for fiscal year 2015:
|
|
| ||||||
| ||||||||
|
|
| ||||||
|
| Key Attributes/
| ||||||
Lee C. Banks |
President and Chief Operating Officer, Parker Hannifin Corporation | Yes | Compensation | Significant executive general management and operational experiences and a unique perspective in identifying strategic and tactical risks attendant to a multi-national sales, distribution, manufacturing, and operational footprint. | ||||
Randolph W. Carson | Retired | Yes | Audit and Governance & Nominating | Deep operational experience in global industrial businesses, strategic vision, and understanding of | ||||
Victor L. Richey, Jr. | Chair of the | Yes | Compensation and Governance & Nominating | Extensive experience as chair, president, and chief executive officer of a diversified global producer and marketer of technology; significant executive management and board experience at public and private companies. | ||||
Nordson Corporation – 2019 Proxy Statement | | 3 |
Fiscal year 2018 was a year of outstanding results in an uncertain andlow-growth global macroeconomic environment. The following highlights our performance for fiscal year 2018:
Record Sales | Record Operating Profit | Record Net Income | ||||||||||
$2.3 Billion 9% increase over 2017 | $495 Million 8% increase over 2017 | $377 Million 28% increase over 2017 | ||||||||||
Record Free Cash Flow(1) | Record GAAP Diluted Earnings Per Share | Record Full Year EBITDA(2) | ||||||||||
$415 Million 110% of net income | $6.40 26% increase over 2017 | $605 Million 11% increase over 2017 | ||||||||||
Operating Margin | Dividends Paid | Total Shareholder Return(3) | ||||||||||
22% | $72 Million 55th consecutive year dividend has increased | 3 Year: 25.9% 5 Year: 66.8% 10 Year: 392.7% |
| (1) | “Free cash flow,” anon-GAAP measure, is determined from our consolidated statement of cash flows and for 2018 represents $504.6 million of net cash provided by operating activities minus $89.8 million of additions to property, plant, and equipment plus $0.5 million of proceeds from the sale of property, plant, and equipment. |
| (2) | “EBITDA,” anon-GAAP measure, is defined as earnings before interest, taxes, depreciation, and amortization. |
| (3) | We define “Total Shareholder Return” as: (share price end of |
4 | | Nordson Corporation – |
The tableinformation below presentsreflects highlights of our named executive officer compensation program for fiscal year 2015.2018. The table istables are not a substitutesubstitutes for, nor does itdo they reflect, all of the information provided in the Summary Compensation Table presented later in this Proxy Statement. During our 2018 Annual Meeting, approximately 97.70% of shareholder votes cast were in favor of the compensation paid to our named executive officers. We value this positive endorsement by our shareholders of our executive compensation policies.
Additional information about our compensation philosophy and program, including the compensation awarded to each of our named executive officers, canmay be found in the “Executive Compensation: Compensation Discussion and Analysis inAnalysis” section of this Proxy Statement.
Base Salary
|
Annual Cash Incentive Award
| |||||
|
Base salary increases for | Target bonus opportunity range for our named executive officers other than our CEO: 65% – 75% of base salary. Target bonus opportunity for CEO: 100% of base salary | ||||
Long-term Compensation | ||
|
| |
|
Other Equity Awards
|
The tables below present FY2016 – FY2018 reported results for the three primary drivers of incentive compensation for the named executive officers – Diluted Earnings per Share, Return on Total Capital, and Revenue:
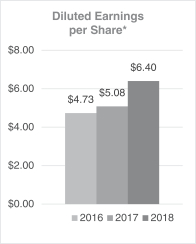 | 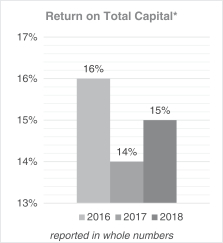 | 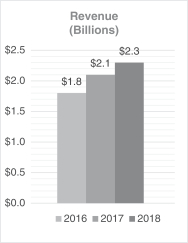 |
Diluted Earnings per Share* Return on Total Capital* Revenue (Billions)
| * |
|
Nordson Corporation – 2019 Proxy Statement | | 5 |
CEO Compensation – 2018 Opportunity and Earned/Realized
| Pay Component | 2018 Compensation Opportunity | 2018 Compensation Realized | ||
Base Salary | $925,000 | $925,000 | ||
Annual Cash Incentive | $925,000 (at target) | $1,082,250 | ||
Long-Term Compensation
Ø FY2016-2018 Performance Share Incentive Award
|
Target # of performance share units:
18,400 Grant date fair value at target: $1,245,496
|
# of performance share units earned:
34,095 Award settlement date value: $3,844,552
| ||
Ø Other FY 2018 Equity Awards | Stock Options:
55,800 shares $1,942,599 grant date fair value
Restricted Shares:
6,700 shares $855,389 grant date fair value
| Stock Options:
105,000 options exercised in FY 2018 Value Realized: $9,883,940
Restricted Shares:
# of shares vested: 8,049 Value Realized: $1,027,733
|
| 6 | | Nordson Corporation – |
The following table summarizes the structure of our Board structureof Directors and key elements of our corporate governance framework:
Director Independence | ||||||||
Tenure of Independent Directors | Oversight of Risk | |||||||
Eight of nine directors are independent
Audit, Compensation, and Governance Committees all composed of independent directors |
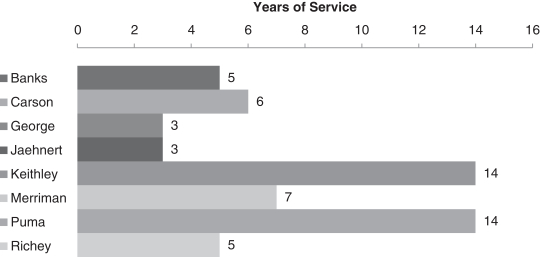
6 years: George and Jaehnert
| |||||||
Average tenure: 10 years | The Board as a whole exercises its oversight responsibilities with respect to material risks The Board has delegated responsibility for the oversight of specific risks to Board committees | |||||||
Meeting of Independent Directors | Board Meeting Attendance | Board Leadership and Structure | ||||||
Executive sessions of independent directors are conducted during each Board meeting | Each of our directors committee meetings | |||||||
Classified with three classes of directors
Independent Michael J. Merriman, Jr. | ||||||||
Voting Standard for Election of Directors | ||||||||
Share Ownership Guidelines | Board Self-Assessments | |||||||
Plurality vote with director resignation policy for failure to receive a majority vote in uncontested director elections. | Share ownership guidelines for directors and executive officers: • Directors – 5x cash retainer • CEO – 5x base salary • CFO – 3x base salary • Other executive officers – 2x base salary | Board, Committee, and Peer | ||||||
Chief Executive Officer Performance | Hedging/Pledging Transactions | Clawback Policy | ||||||
Annual review by | Strict policy of no pledging or hedging of company shares | |||||||
Robust policy | ||||||||
Advisory Vote on Named Executive Officer Compensation | ||||||||
Shareholder Rights Plan (“Poison Pill”) | Average Age of Independent Directors | |||||||
Annual Vote | No | |||||||
|
Nordson Corporation – | | |
DIRECTORS SERVING ON BOARDS OF OTHER PUBLIC COMPANIES
Board service by members of our Board of Directors is within the limits set by our Governance Guidelines:
“It is the Company’s policy that a Director who is not an executive officer of a public company may serve as a director on up to five other boards of public companies. For Directors who are also serving as an executive officer of a public company, the maximum number of public company boards on which the Director may serve is two in addition to serving as a director on the board of his or her company.”
Lee C. Banks |
| |
|
| |
|
| |
|
| |
Frank M. Jaehnert |
| |
Joseph P. Keithley |
| |
Michael J. Merriman, Jr. (Chair) |
| |
Mary G. Puma |
| |
Victor L. Richey, Jr. |
| |
| Nordson Corporation – |
FOR THE ANNUAL MEETING OF SHAREHOLDERS
MARCH 1, 2016FEBRUARY 26, 2019
The accompanying proxy is solicited on behalf of the Board of Directors (the “Board”) of Nordson Corporation for use at the 20162019 Annual Meeting. The Annual Meeting will be held at Squire Patton Boggs (US)the law offices of BakerHostetler LLP, 49002000 Key Tower, 127 Public Square, Cleveland, Ohio 44114 at 8:00 a.m., eastern standard time,Eastern Time, on Tuesday, March 1, 2016February 26, 2019 for the following purposes:
| 1. | To elect as directors three nominees, named in this Proxy Statement and recommended by the Board, to serve until the |
| 2. | To ratify the appointment of Ernst & Young LLP as our independent registered public accounting firm for the fiscal year ending October 31, |
| 3. | To approve, on an advisory basis, the compensation of our named executive officers; and |
| 4. | To transact such other business as may properly come before the Annual Meeting or any adjournment or postponement thereof. |
This Proxy Statement and the accompanying proxy/voting instruction card were first mailed to shareholders on or about January 29, 2016.18, 2019. Our 20152018 Annual Report to Shareholders is enclosed with this Proxy Statement.
This Proxy Statement contains important information regarding our Annual Meeting, the proposals on which you are being asked to vote, information you may find useful in determining how to vote, and information about voting procedures. As used in this Proxy Statement, “we,” “us,” “our,” “Nordson” or the “Company” refers to Nordson Corporation.
Nordson Corporation – | | |
PROPOSAL 1: ELECTION OF DIRECTORS WHOSE TERMS EXPIRE IN 20192022
The Governance and Nominating Committee is responsible for identifying and evaluating nominees for director and for recommending to the Board a slate of nominees for election at the Annual Meeting. The Governance and Nominating Committee has recommended, and the Board has approved, the persons named as nominees for terms expiring in 20192022 and, unless otherwise marked, a duly executed and properly submitted proxy will be voted for such nominees. Nominees Lee C. Banks, Randolph W. Carson, and Victor L. Richey, Jr. currently serve as directors. All nominees have agreed to stand for election for a three-year term.
In considering each director nominee and the composition of the Board as a whole, the Governance and Nominating Committee considers a diverse group of experiences, qualifications, attributes and skills,including diversity in gender, ethnicity, and race, which the Governance and Nominating Committee believes enables a director nominee to make significant contributions to the Board, Nordson, and our shareholders. A non-exclusive list
The current-serving directors, including the nominees, collectively have a mix of various skills and qualifications, some of which are listed in the table below. These collective attributes enable the Board to provide insightful leadership as it strives to advance our strategies and deliver returns to shareholders.
Global Business Experience | Mergers & Acquisitions Experience |
Experience working outside the United States and/or with global enterprises to help oversee the management of our global operations. | Experience working on M&A transactions, which provides insight into developing and implementing strategies for growing our businesses. | |||
Financial Experience | Public Company CEO Experience |
Experience with finance, accounting, and/or financial reporting to help drive our operating and financial performance. | Experience as a public company CEO to help us drive business strategy, growth and performance, and create shareholder value. | |||
Public Company Board Experience | Capital Allocation Experience |
Experience working with publicly-traded companies and corporate governance issues to help us oversee an ever-changing mix of strategic, operational, and compliance-related matters. | Experience with capital allocation decision-making to help us allocate capital efficiently. | |||
Strategy Development | Manufacturing Experience |
Experience with the development and oversight of long-term planning. | Experience with manufacturing operations to help us drive operating performance. | |||
See director biographies beginning on page 12 for further detail.
| 10 | | Nordson Corporation – 2019 Proxy Statement |
The average tenure of our independent directors is 10 years and the average age of our independent directors is 62 years. Twenty-five percent of our independent directors represent gender and racial diversity.
In determining whether to recommend a director forre-election, the Governance and Nominating Committee considers the director’s skills and expertise, participation in and contributions to the activities of the sought-after experiencesBoard, the results of the annual Board evaluation, and attributes can be found in the Director Recruitment and Performance Guidelines available at:www.nordson.com/en/our-company/corporate-governance.
Since 2009, Nordson has experienced a significant “refresh” of its independent directors, with five independent directors having six years or less of service with Nordson:
We believe that the tenure spectrum of our Directorsdirectors provides an effective mix of deep knowledge and new perspectives. We are strongly opposed toThe Board does not believe in a one-size-fits-all modelspecific limit for the overall length of corporate governancetime an independent director may serve. Directors who have served on the Board for an extended period can provide valuable insight into the operations and believe that each board should consider its own circumstancesfuture of the Company based on their experience with, and that a reasonable approach is likely to ensure an appropriate balance between long-tenuredunderstanding of, the Company’s history, policies, and more recently added board members.objectives. Our Governance Guidelines provide that a director is expected to retire at the conclusion of the Board meeting immediately prior to a director’s 72nd birthday. We do not, however, have a policy limiting the tenure of a director. In our view, the best method to ensure healthy board evolution is through rigorous and thoughtful consideration of the nomination of current directors prior to each election based on a variety of factors, including director performance, skills and expertise, the Company’s needs, and board diversity, as well as length of board service, both on a board average and stand-alone basis.
With respect to Mr. Keithley and Ms. Puma, we see a strategic advantage in theirsenior-in-service status. Not only do they bring experience, deep institutional knowledge, and historical context to the vitality and growth of Nordson, they serve as seasoned advisors to Mr. Hilton, who has been Nordson’s Chief Executive Officer for six years.Hilton.
It is intended that proxies that are duly executed and properly submitted but do not withhold the authority to vote for any or all of the nominees will be voted for the election as directors of all of the nominees named below. At this time, the Board knows of no reason why any nominee might not be a candidate at the 20162019 Annual Meeting. However, in the event any one or more of such nominees becomes unavailable for election, proxies will be voted in accordance with the best judgment of the proxy holder.
The name and age (as of February 26, 2019) of each of the three nominees for election as directors for terms expiring in 2019,2022, as well as present directors whose terms will continue after the Annual Meeting, appear below, together with his or her principal occupation for at least the past five years, the year each became a director of the Company and certain other relevant information.
Nordson Corporation – 2019 Proxy Statement | | 11 |
Nominees Forfor Terms Expiring in 20192022
LEE C. BANKS | Age: | Director Since 2010 |
Business Experience. Mr. Banks was electedhas been president and chief operating officer of Parker HannifinParker-Hannifin Corporation in(NYSE: PH) since February 2015. Parker Hannifin Corporation (NYSE: PH)Parker-Hannifin is the world’s leading diversified manufacturer of motion and control technologies and systems, providing precision-engineered solutions for a wide variety of mobile, industrial, and aerospace markets. Mr. Banks served as executive vice president and operating officer of Parker HannifinParker-Hannifin from 2008 to 2015 and senior vice president and operating officer of Parker HannifinParker-Hannifin from 2006 to 2008.
Other Directorships in Previous 5 Years.Current Directorships. Mr. Banks is a director of Parker Hannifin.Parker-Hannifin.
Key Attributes, Experiences, and Skills. As a senior executive and director of a multi-national corporation, Mr. Banks provides the Board with significant executive general management and operational experiences and a unique perspective in identifying governance, strategic, and tactical risks attendant to a multi-national sales, distribution, manufacturing, and operational footprint.
RANDOLPH W. CARSON | Age: | Director Since 2009 |
Business Experience. From 2000 to February 2009, Mr. Carson served as chief executive officer of Eaton Corporation’s (NYSE: ETN) Electrical Group. Eaton (NYSE: ETN) is a global, diversified industrial manufacturer and technology leader in electrical components and systems for power quality, distribution, and control. Mr. Carson retired from Eaton in May 2009 following ten years with the company. Prior to Eaton Corporation, Mr. Carson held several executive positions with Rockwell International.
Other Directorships in Previous 5 Years.Current Directorships. Mr. Carson is a director of Fairchild Semiconductor International, Inc. (NASDAQ: FCS), a leading global manufacturer of semiconductor devices, and the Southwire Company, LLC, the leading North American supplier of wire and cable products.
Key Attributes, Experiences, and Skills. Mr. Carson served as chairmana director of Fairchild Semiconductor International, Inc. (formerly, Nasdaq: FCS), a leading global manufacturer of semiconductor devices, until September 2016, when ON Semiconductor Corporation (Nasdaq: ON) closed its acquisition of Fairchild. Mr. Carson served as chair of the board of GrafTech International, Ltd. (formerly, NYSE: GTI)(NYSE: EAF), a global manufacturer of carbon and graphite products, prior to GrafTech becoming an indirect wholly-owned affiliate of Brookfield Asset Management Inc. (NYSE:BAM) (TSX: BAM.A) (Euronext: BAMA). Brookfield is a global alternative asset manager with over $200 billion in assets under management.
Key Attributes, Experiences and Skills.Our Board believes that Mr. Carson’s deep operational experience in global industrial businesses enables him to provide unique insight to our Board with respect to meeting marketplace challenges, implementing Lean and other productivity initiatives, integrating business units, and anticipating and planning for commercial risk and uncertainties. Together with his experience, strategic vision, and understanding of financial accounting and financial matters, our Board believes Mr. Carson is well qualified to serve as a member of our Board. Mr. Carson’s public company board experience contributes to his familiarity with current issues and his ability to identify and address matters that come before the Governance & Nominating and Audit Committees on which he serves.
|
VICTOR L. RICHEY, JR. | Age: | Director Since 2010 |
Business Experience. Mr. Richey has been chairmanchair of the board, president, and chief executive officer of ESCO Technologies Inc. (NYSE: ESE) since 2003. ESCO Technologies manufactures highly engineeredhighly-engineered filtration and fluid control products for the aviation, space, and process markets worldwide andworldwide; is the industry leader in RF shielding and EMC products. It alsotest products; provides diagnostic instruments, software, and services andfor the premier library of statistically significant apparatus test results in supportbenefit of the electric utility industry and industrial power grid.users; and produces custom thermoformed packaging, pulp-based packaging, and specialty products for medical and commercial markets.
| 12 | | Nordson Corporation – 2019 Proxy Statement |
Other Directorships in Previous 5 Years.Current Directorships. Mr. Richey is chairmanchair of the board of ESCO Technologies.
Key Attributes, Experiences, and Skills. TheOur Board believes Mr. Richey provides a breadth of skills critical to the Board’s ability to discharge its oversight responsibility. Mr. Richey has extensive experience as chairman,chair, president, and chief executive officer of a diversified global producer and marketer of technology, and he has significant executive management and board experience at public and private companies within some of our end markets, including the semiconductor industry.
Present Directors Whosewith Terms ExpireExpiring in 20172020
JOSEPH P. KEITHLEY | Age: | Director Since 2001 |
Business Experience. Mr. Keithley has served as chairman of the board of Nordson Corporation since February 2010. He served as chairmanchair of the board of Keithley Instruments, Inc., a provider of measurement solutions to the semiconductor, fiber optics, telecommunications, and electronics industries, from 1991 as well as a member of its board of directors from 1986 until December 2010 when Keithley Instruments was purchased by Danaher Corporation.Corporation (NYSE: DHR). He also served as Keithley Instruments’ chief executive officer from November 1993 to December 2010, and as president from May 1994 to December 2010, and as a member of its board of directors from 1986 until December 2010.
Other Directorships in Previous 5 Years.Current Directorships. Mr. Keithley is a director of Axcelis Technologies, Inc. (Nasdaq GS: ACLS), a provider of equipment and service solutions for the semiconductor manufacturing industry.
Key Attributes, Experiences, and Skills. Mr. Keithley previously served as chairmanchair of our Board, as chair of the board of Keithley Instruments. He isInstruments, and as a director of Materion Corporation (NYSE: MTRN), an integrated producer of high performance engineered materials used in a variety of electrical, electronic, thermal, and structural applications, and Axcelis Technologies, Inc. (NASDAQ GS: ACLS), a provider of equipment and service solutions for the semiconductor manufacturing industry.
Key Attributes, Experiences and Skills.applications. Mr. Keithley brings extensive, broad-based international business and executive management and leadership experience from his leadership roles at Keithley Instruments to his role as chairmana member of our board of directors.Board. Among other things, Mr. Keithley draws upon his extensive knowledge inof the global semiconductor and electronics industries garnered while leading Keithley Instruments. Mr. Keithley also has extensive public company board and governance experience.
MICHAEL J. MERRIMAN, JR. | Age: | Director Since 2008 |
Business Experience. Mr. Merriman has beenserved as chair of our Board since February 2018. Mr. Merriman was an operating advisor of Resilience Capital Partners LLC sincefrom June 2008.2008 until June 2017, and currently serves on the board of one of Resilience’s portfolio companies. Resilience is a private equity firm focused on principal investing in lower middle market underperforming and turnaround opportunities. Mr. Merriman is also a business consultant for Product Launch Ventures, LLC, a company that he founded in 2004 to pursue consumer product opportunities and provide business advisory services. Mr. Merriman served as president and chief executive officer of Lamson & Sessions Co. (formerly, NYSE: LMS), a manufacturer of thermoplastic conduit, fittings and electrical switch and outlet boxes, from November 2006 to November 2007. Mr. Merriman served as senior vice president and chief financial officer of American Greetings Corporation (formerly, NYSE: AM), a designer, manufacturer and seller of greeting cards and other social expression products, from September 2005 until November 2006.
Other Directorships in Previous 5 Years.Current Directorships. Mr. Merriman is a director of Invacare Corporation (NYSE: IVC), a global leader in the manufacture and distribution of innovative home and long-term care medical products that promote recovery and active lifestyles; Regis Corporation (NYSE: RGS), a company that owns, franchises, and operates beauty salons, hair restoration centers and cosmetology education;education facilities; and of OMNOVA Solutions Inc. (NYSE: OMN), a technology-based company and an innovator of emulsion polymers, specialty chemicals, and decorative and functional surfaces for a variety of commercial, industrial, and residential end uses.
Key Attributes, Experiences, and Skills. Mr. Merriman was a director of Invacare Corporation (NYSE: IVC), a global leader in the manufacture and distribution of innovative home and long-term care medical products that promote recovery and active lifestyles, until May 2018, and a director of
Nordson Corporation – 2019 Proxy Statement | | 13 |
American Greetings from 2006 through August 2013 when American Greetings became a private company. Mr. Merriman also served as a director of RC2 Corporation (formerly, Nasdaq: RCRC), a manufacturer ofpre-school toys and infant products, from 2004 until its sale in April 2011 for RC2 Corporation (formerly, NASDAQ: RCRC), a manufacturer of pre-school toys and infant products.2011.
Key Attributes, Experiences and Skills.Mr. Merriman’s prior experience as a public company chief executive officer and chief financial officer and his current service on the boards of directors of threetwo publicly traded companies, as well as his experience at Resilience, provides him with valuable experience and significant knowledge in the areas of executive management, strategy, corporate governance, acquisitions and divestitures, finance and financial reporting, product development expertise, and investor relations. Mr. Merriman has significant finance, financial reporting, and accounting expertise and was formerly a certified public accountant, which provides the Board with valuable expertise and qualifies him as a “financial expert” on the Audit Committee, as described under the “Audit Committee” caption in the Corporate Governance section of this Proxy Statement.financial expertise.
MARY G. PUMA | Age: | Director Since 2001 |
Business Experience. Ms. Puma is president and chief executive officer of Axcelis Technologies, Inc. (NASDAQ(Nasdaq GS: ACLS). Axcelis is a provider of equipment and service solutions for the semiconductor manufacturing industry. Ms. Puma has served as chief executive officer of Axcelis since January 2002.
Other Directorships in Previous 5 Years.Current Directorships. Ms. Puma serves asis a director of Axcelis Technologies.Axcelis. From May 2005 to May 2015, Ms. Puma was chairmanchair of the board of Axcelis.
Key Attributes, Experiences, and Skills. Ms. Puma contributes extensive generalexecutive management experience in an international, technology-driven business and possesses a thorough knowledge of corporate governance and strategy development. Ms. Puma brings valuable experience in compensation and talent management planning matters to our Compensation and Governance & Nominating Committees, respectively.Committee.
Present Directors Whosewith Terms ExpireExpiring in 20182021
ARTHUR L. GEORGE, JR. | Age: | Director Since 2012 |
Business Experience. Mr. George served as senior vice president and manager, Analog Engineering Operations of Texas Instruments Incorporated (NASDAQ GS: TXN) from 2011 until his retirement in March 2014. Texas Instruments (Nasdaq: TXN) is one of the world’s largest semiconductor companies and a highly innovative, high performing global leader in analog, embedded processing, and wireless technologies. Mr. George was senior vice president and worldwide general manager, High Performance Analog of Texas Instruments from 2006 to 2011.
Other Directorships in Previous 5 Years.Current Directorships. Mr. George serves asis a director of Axcelis Technologies, Inc. (NASDAQ(Nasdaq GS: ACLS), a provider of equipment and service solutions for the semiconductor manufacturing industry.
|
Key Attributes, Experiences, and Skills. Mr. George brings to the Board significant executive and general management experience as well as extensive operational and new product development experiences in high technology markets. Mr. George’s experience with high performance analog products used in a wide range of industrial products gives him insight on a diverse set of industries and affords the Board a unique perspective in identifying strategic and tactical risks attendant to the semiconductor electronics market.
MICHAEL F. HILTON | Age: | Director Since 2010 |
Business Experience. Mr. Hilton became Nordson’s Presidentpresident and Chief Executive Officerchief executive officer effective January 16, 2010. Prior to his joining Nordson, Mr. Hilton was senior vice president and general manager for Air Products and Chemicals, Inc. (NYSE: APD) from 2007 until 2010, with specific responsibility for leading the company’s $2 billion global Electronics and Performance Materials segment. Air Products and Chemicals serves customers in industrial, energy, technology, and healthcare markets worldwide with a unique portfolio of atmospheric gases, process and specialty gases, performance materials, and equipment and services.
| 14 | | Nordson Corporation – 2019 Proxy Statement |
Other Directorships in Previous 5 Years.Current Directorships. Mr. Hilton serves asis a director of Ryder System, Inc. (NYSE: R), a FORTUNE® 500 provider of leading-edge transportation, logistics, and supply chain management solutions. He is also serves as a director of Lincoln Electric Holdings, Inc. (NASDAQ:(Nasdaq: LECO). Lincoln Electric is the world leader in the design, development, and manufacture of arc welding products, robotic arc welding systems, plasma and oxyfuel cutting equipment and has a leading global position in the brazing and soldering alloys market.
Key Attributes, Experiences, and Skills. Mr. Hilton is the only member of Nordson’s management serving on the Nordsonour Board. With over 30 years of global manufacturing industry experience, Mr. Hilton brings to the Nordson Board an intimate understanding of management leadership, strategy development, andday-to-day operations of a multi-national company, including product line management, new product technology and talent development, manufacturing, distribution and other sales channels, business processes, international operations, and global markets.
FRANK M. JAEHNERT | Age: | Director Since 2012 |
Business Experience. Mr. Jaehnert served as chief executive officer and president of Brady Corporation (NYSE: BRC) from April 1, 2003 through October 7, 2013. Brady Corporation is an international manufacturer and marketer of complete solutions that identify and protect premises, products, and people. Brady’s core capabilities in manufacturing, channel management, printing systems, precision engineering and materials expertise make it a leading supplier to customers in general manufacturing, maintenance and safety, process industries, construction, electrical, telecommunications, electronics, laboratory/healthcare, airline/transportation, brand protection, education, governmental, public utility, and a variety of other industries.
Other Directorships in Previous 5 Years.Current Directorships. Mr. Jaehnert serves asis a director of Briggs & Stratton Corporation (NYSE: BGG), a world leader in gasoline engines for outdoor power equipment, portable generators, and lawn and garden powered equipment and related accessories. He is also serves as a director of Itron, Inc. (NASDAQ:(Nasdaq: ITRI), a world-leading technology and services company dedicated to the resourceful use of energy and water and providing comprehensive solutions that measure, manage, and analyze energy and water.
Key Attributes, Experiences, and Skills. Mr. Jaehnert served as a director of Brady Corporation from April 1, 2003 through October 7, 2013.
Key Attributes, Experiences and Skills. Mr. Jaehnert has been the chief executive officer and president of a global manufacturing business. He also served as chief financial officer of that business. His prior work experience includes various financial positions in Germany and in the United States for Robert Bosch GmbH, an international manufacturer of automotive, communications, industrial, and consumer products. Mr. Jaehnert received the equivalent of a master of business administration
degree from the University of Stuttgart, Germany, and has been designated as a “financial expert” on the Audit Committee, as described under the “Audit Committee” caption in“Committees of the Corporate GovernanceBoard of Directors” section of this Proxy Statement. Mr. Jaehnert’s experience as head of a diversified international business and his expertise in finance and operations enable him to make significant contributions to discussions regarding the Company’s strategy and the activities of the Audit Committee.
No shareholder or group that beneficially owns 1% or more of our outstanding common shares has recommended a candidate for election as a director at the 20162019 Annual Meeting.
Cumulative Voting
Voting for directors will be cumulative if any shareholder provides notice in writing to the President, aan Executive Vice President, or the Secretary of Nordson of a desire to have cumulative voting. The notice must be received at least 48 hours before the time set for the Annual Meeting, and an announcement of the notice must be made at the beginning of the meeting by the ChairmanChair or the Secretary, or by or on behalf of the shareholder giving the notice. If cumulative voting is in effect, each shareholder will be entitled to cast, in the election of directors, a number of votes equal to the product of the number of directors to be elected multiplied by the number of shares that the shareholder is voting. Shareholders may cast all of these votes for one nominee or distribute them among several
Nordson Corporation – 2019 Proxy Statement | | 15 |
nominees, as they see fit. If cumulative voting is in effect, shares represented by each properly submitted proxy will also be voted on a cumulative basis, with the votes distributed among the nominees in accordance with the judgment of the persons named on the proxy/voting instruction card.
To date, we have not received a notice from any shareholder of his, her, or its intention to request cumulative voting.
Majority Voting Policy
The Director nominees receiving the greatest number of votes will be elected (plurality standard). However, our majority voting policy states that any Director who fails to receive a majority of the votes cast in his/her favor is required to submit his/her resignation to the Board. The Governance and Nominating Committee of the Board would then consider each resignation and determine whether to accept or reject it. Abstentions and brokernon-votes will have no effect on the election of a Director and are not counted under our majority voting policy.
Required Vote
The election of directors requires the affirmative vote of the holders of a plurality of the shares of common stock voting at the Annual Meeting. Under the plurality voting standard, the nominees receiving the most “for” votes will be elected, regardless of whether any nominee received a majority of the votes. Only shares that are voted in favor of a particular nominee will be counted toward such nominee’s achievingachievement of a plurality. Shares present at the meeting that are not voted for a particular nominee or shares present by proxy where the shareholder properly withheld authority to vote for such nominee (including brokernon-votes) will not be counted toward such nominee’s achievingachievement of a plurality, but will be counted for quorum purposes.
RECOMMENDATION REGARDING PROPOSAL 1:
THE BOARD OF DIRECTORS RECOMMENDS THAT YOU VOTE “FOR” ALL NOMINEES AS DIRECTORS.
PROXIES RECEIVED BY THE BOARD WILL BE VOTED FOR ALL NOMINEES UNLESS SHAREHOLDERS SPECIFY A CONTRARY VOTE.
|
16 | | Nordson Corporation – |
Corporate Governance Documents
The following corporate governance documents are available at:www.nordson.com/en/our-company/corporate-governance.
• Governance Guidelines | • Related Persons Transaction Policy | |
• Committee Charters | • Share Ownership Guidelines | |
• Director Recruitment and Performance Guidelines | • Code of Ethics and Business Conduct • Suppliers Code of Conduct | |
• Conflict Minerals Policy |
The Governance Guidelines contain general principles regarding the functions of Nordson’s Board of Directors (the “Board”) and Board committees. The Annual Report to Shareholders, which includes the 20152018 Annual Report and this Proxy Statement, are available at:www.nordson.com/en/our-company/investors/annual-reports-and-presentations. Upon request, copies of the Annual Report to Shareholders will be mailed to you (at no charge) by contacting Nordson Corporation, Attn: Corporate Communications, 28601 Clemens Road, Westlake, Ohio 44145. The information in, or that can be accessed through, our internet site is not part of this proxy statement,Proxy Statement, and all references herein to our internet site are inactive textual referencesfor reference purposes only.
Director Independence
In accordance with the listing standards of The NASDAQNasdaq Stock Market LLC (“NASDAQ”Nasdaq”), and our Governance Guidelines, the Board must consist of a majority of independent directors. The Board has determined that Ms. Puma and Messrs. Banks, Carson, George, Jaehnert, Keithley, Merriman, and Richey each satisfy the definition of “independent director” under these listing standards. Mr. Hilton is not an independent director asbecause he serves as our President and Chief Executive Officer.
In determining independence, each year the Board affirmatively determines, among other things, whether directors have a “material relationship” with Nordson. When assessing the “materiality” of a director’s relationship with Nordson, the Board considers all relevant facts and circumstances, including a consideration of the persons or organizations with which the director has an affiliation. Where an affiliation is present, the Board considers the frequency or regularity of the provision of services, whether the services are being carried out at arm’s length in the ordinary course of business and whether the services are being provided substantially on the same terms to Nordson as those prevailing at the time from unrelated parties for comparable transactions. With respect to Audit Committee members, the Board must affirmatively determine that such directors, in addition to the general independence requirements described above, satisfy certain financial education requirements and do not, among other things, accept any consulting, advisory, or other compensatory fee from Nordson.
As part of our commitment to ensuring director independence, we have a monitoring and reporting program with respect to purchases of products supplied by, or to, a company which may employ a director to ensure the avoidance of any conflicts of interest resulting from our relationship. Mr. Banks, a director, serves as president and chief operating officer of Parker HannifinParker-Hannifin Corporation. Mr. Jaehnert,Richey, a director, serves as a director of Briggs & Stratton Corporation.ESCO Technologies Inc. These two companies purchase components manufactured by a number of our business units in volumes that are insignificant when compared to the respective companies’ and Nordson’s annual revenue for fiscal year 2015.2018. The Board does not believe that these relationships impair the independence of Messrs. Banks or JaehnertRichey or that they have any material interest in any transaction between Nordson and Parker Hannifin and Briggs & Stratton Corporation,ESCO, respectively. For more information on our review standards for related party transactions, see “Review of Transactions with Related Persons” below.
Nordson Corporation – 2019 Proxy Statement | | 17 |
Director Qualifications
Through its selection and vetting process, the Governance and Nominating Committee seeks not only to identify directors that meet basic criteria, but also to enhance the diversity of the Board in such areas
as professional experience, geography, race, gender, ethnicity, and age and to obtain a variety of occupational, educational, and personal backgrounds on the Board in order to obtainprovide a range of viewpoints and perspectives. As a whole, we believe that the Board should possess a combination of skills, professional experience, and diversity of backgrounds necessary to oversee the Company’s business. Diversity of background includes racial and gender diversity. Having directors with a wide range of perspectives allows the Company to better understand and serve our clients and to continue to adapt our business to a constantly changing world. Our focus on diversity has led to a diverse boardroom. Twenty-twoTwenty-five percent of our independent directors are women or racially diverse individuals.
The Governance and Nominating Committee also periodically evaluates the composition of the Board to assess the skills and experience that are currently represented on the Board, as well as the skills and experience that the Board will find valuable in the future, givenconsidering the Company’s current situation and strategic plans. We believe that this focus on finding qualified directors from diverse backgrounds has allowed the Company to assemble a Board comprised of directors of the highest caliber and with a wide range of viewpoints.
Consideration of Director Candidates Recommended by Shareholders
Under its charter, the Governance and Nominating Committee is responsible for reviewingvetting shareholder nominations forof directors. The Committee does not have a formal policy with respect to the consideration of director candidates recommended by shareholders. However, its practice is to consider those candidates on the same basis and in the same manner as it considers recommendations from other sources. For more information on how a shareholder can recommend a candidate, see the “Questions and Answers About the Annual Meeting and These Proxy Materials” section of this proxy statement.
Code of Ethics and Business Conduct
We have a Code of Ethics and Business Conduct (the “Code”) that applies to all Nordson directors, officers, and employees, of Nordson Corporation and its subsidiaries, wherever located. Our Code contains the general guidelines and principles for conducting Nordson’s business consistent with the highest standards of business ethics. Our Code embodies our five guiding values, which form the foundation of our Company: Integrity, Excellence, Passion for Our Customers, Energy, and Respect for People. Our employees are expected to report all suspected violations of Company policies and the law, including incidents of harassment or discrimination. We will take appropriate steps to investigate all such reports and will take appropriate action. Under no circumstances will employees be subject to any disciplinary or retaliatory action for reporting, in good faith, a possible violation of our Code or applicable law or for cooperating in any investigation of a possible violation.
Board Leadership Structure
Our Governance Guidelines require us to have either an independent ChairmanChair of the Board or a presiding independent director if the ChairmanChair is not an independent director. The Governance Guidelines set forth the responsibilities of the ChairmanChair of the Board and the Presiding Director when the ChairmanChair of the Board is not an independent director. At present, the ChairmanChair of the Board position is separate from the Chief Executive Officer position. The Board’s role in risk oversight does not affect the Board’s leadership structure.
This structureWe believe that separating the Chair of the Board and Chief Executive Officer positions provides independent oversight of management while permitting our Chief Executive Officer, Michael Hilton, to focus his time and energy on setting the strategic direction for the Company, overseeing daily operations, engaging with external constituents, developing and mentoring our future leaders, and promoting employee engagement at all levels of the organization. Our independent ChairmanChair of the Board, of Directors, Joseph Keithley,Michael J. Merriman, Jr., leads the Board in the performance of its duties by establishing
| 18 | | Nordson Corporation – 2019 Proxy Statement |
agendas and ensuring appropriate meeting content (in collaboration with Mr. Hilton), presiding during regularly held executive sessions with our independent directors, actively engaging with all independent directors and Mr. Hilton between Board meetings, and providing overall guidance to Mr. Hilton as to the Board’s views and perspectives, particularly on the strategic direction of the Company.
|
Meetings of the Board of Directors
The Board held sixtwelve meetings during fiscal year 2015.2018. In addition, there were a total of 18eighteen meetings of our committees. Nordson’s policy is to require attendance and active participation by directors at Board and committee meetings. Each director attended at least 75% of the total number of meetings of the Board and the committees on which the director served during fiscal year 2015.2018. Directors are encouraged to attend the Annual Meeting. All of Nordson’s directors attended the 20152018 Annual Meeting of Shareholders held on February 24, 2015.27, 2018.
Executive Sessions of Independent Directors
Pursuant to our Governance Guidelines, independent directors meet in regularly scheduled executive sessions without management. The ChairmanChair of the Board of Directors (or, when our ChairmanChair is not an independent director, the Presiding Director) chairs all regularly scheduled executive sessions of the Board, and also has authority to convene meetings of the independent directors at any time with appropriate notice. Chairman Keithley presided at executive sessions of our independent directors at every Board meeting in 2015.
Oversight of Risk
The Board plays an active role, both as a whole and also at the committee level, in overseeing management of the Company’s risks. Management is responsible for the Company’sday-to-day risk management activities. The Company has established an enterprise risk framework for identifying, aggregating, and evaluating risk across the enterprise. The risk framework is integrated with the Company’s annual planning, audit scoping, and control evaluation management by its internal auditor.
The involvement of the Board in assessing our business strategy at least annually is a key part of its oversight of risk management, its assessment of management’s appetite for risk, and its determination of what constitutes an appropriate level of risk for Nordson Corporation.Nordson. The Board regularly receives updates from management and outside advisors regarding this oversight responsibility.
In addition, our Board committees each oversee certain aspects of risk management as presented below:
Audit Committee | Compensation Committee | Governance and Nominating | ||||||
Risks associated with financial matters, particularly financial reporting, accounting, disclosure, and internal controls. | ||||||||
| Risks associated with the establishment and administration of executive compensation and equity-based compensation programs and performance management of officers. | |||||||
| Risks associated with Board independence, effectiveness and organization, corporate governance matters, and director succession planning. |
Senior management attends Board and Board committee meetings at the invitation of the Board or its committees and is available to address any questions or concerns raised by the Board on risk management and any other matters.
Both theThe Audit Committee and the Compensation Committee of the BoardCommittees rely also rely on the advice and counsel of our independent auditors and independent compensation consultant, respectively, to raise awareness of any risk issues that may arise during their regular reviews of our financial statements, audit work, and executive compensation policies and practices, as applicable.practices. The Board is kept abreast of its Committees’updated on each committee’s risk oversight and other activities via meeting reports of the Committee Chairpersonsfrom each committee chair to the full Board.
Nordson Corporation – | | 19 |
Review of Transactions with Related Persons
The Board has adopted a written policy regarding the review and approval of transactions involvingbetween the Company and its subsidiaries and certain persons that are required to be disclosed in proxy statements, which are commonly referred to as “related persons transactions.” Related persons include our directors, nominees for election as a director, persons controlling over 5% of our common shares, executive officers, and the immediate family members of each of these individuals. Under the written policy, Nordson’s Audit Committee is responsible for reviewing any related persons transactions and will consider factors it deems appropriate.appropriate, including but not limited to, whether the transaction is on terms no less favorable than terms generally available to an unaffiliated third-party under the same or similar circumstances and the extent of the related person’s interest in the transaction. To the extent any member of the Audit Committee is involved in any transaction under review, such member recuses themselves.
We have a monitoring and reporting program with respect to transactions with products supplied by, or to, a company which may employ a director, to ensure the avoidance of any conflicts of interest resulting from our relationship. This program includes all such transactions collectively over $120,000 in one annual period. Under the program, we reviewed transactions with all companies which employ a director or have one of our directors serveserving as a member of on its board. The review determined that the any related persons transactions were neither material nor significant to either Nordson or the respective director’s company. All such transactions were conducted at arms-length. Information on the related persons transaction review is set forth under the caption “Director Independence” above.
The Board’s Role in Talent Development
A primary Board responsibility is to ensure that we have the appropriate management talent to successfully execute our strategies. Our Board believes that effective talent development is critical to Nordson’s continued success. Our Board’s involvement in leadership development and succession planning is systematic and ongoing. The Board plans for CEO succession and oversees management’s planning for succession of other key executive positions. Our Board calendar includes at least one meeting each year during which the Board conducts a detailed review of the Company’s talent strategies, leadership pipeline, and succession plans for key executive positions. The Compensation Committee oversees the process of succession planning and implements programs to retain and motivate key talent. To assist the Board, the CEO annually provides the Board with anin-depth assessment of senior managers and their potential to succeed to the position of CEO or other key executive positions.
Self-Assessments
On a regular basis, the Board conducts a self-assessment of the Board as a whole to determine, among other matters, whether the Board is functioning effectively. The independent directors also undertake a peer assessment of other independent directors as part of this self-assessment process. Each committee of the Board also conducts a self-assessment of the committee’s effectiveness. The Board considers this process to be the primary means of determining whether incumbent directors continue to demonstrate the attributes that should be reflected on the Board, or whether changes to membership are appropriate.
| 20 | | Nordson Corporation – 2019 Proxy Statement |
COMMITTEES OF THE BOARD OF DIRECTORS
The Board of Directors has three standing committees – Audit Committee, Compensation Committee, and Governance and Nominating Committee – and an Executive Committee. Respective committee functions, memberships and number of meetings held during fiscal year 2018 are listed below. All members of the Audit Committee, Compensation Committee, and Governance and Nominating Committee are independent under the independence standards of NASADQNasdaq and our Governance Guidelines. A more detailed discussion of the purposes, duties, and responsibilities of the committees is found in the Committees respective committee charters which are available at:www.nordson.com/en/our-company/corporate-governance.
| Committee | Function | Members for
| Meetings in
| |||
| Audit | • • •
• |
Carson George
| ||||
|
|
| |||||
Compensation | • • •
| Puma* Banks
Richey | 5 | |||
The Compensation Committee takes significant steps to ensure that we maintain strong links between executive compensation and performance of our business. Examples of these steps are:
• • • • | ||||||
Nordson Corporation – 2019 Proxy Statement | | 21 |
| Committee | Function | Members for 2018(1) | Meetings in 2018 | |||
| Governance | • • • • • • Overseeing management’s development of an orientation program for new directors. • Reviewing Director’s compensation. | Richey* Carson Keithley Puma | ||||
|
| |||||
| * | Committee |
| (1) | In February 2018, Mr. Merriman was elected Chair of the Board and Mr. Jaehnert was elected chair of the Audit Committee. In May 2018, Mr. Merriman was appointed as a member of the Compensation Committee and removed as a member of the Audit Committee and Mr. Keithley was appointed as a member of the Audit Committee and removed as a member of the Compensation Committee. |
The Board has designated Messrs.Mr. Jaehnert, and Merriman, who are eachis an independent directorsdirector under the NASDAQNasdaq listing standings and the SEC’s audit committee requirements, as an “audit committee financial experts”expert” pursuant to the SEC’s final rules implementing Section 407 of the Sarbanes-Oxley Act. Shareholders should understand that the designation of Messrs.Mr. Jaehnert and Merriman each as an “audit committee financial expert” is an SEC disclosure requirement and that it does not impose upon themhim any duties, obligations, or liabilities that are greater than those imposed on themhim as members of the Audit Committee and the Board in the absence of such designation.
The Audit Committee has confirmed Ernst & Young’sYoung LLP’s independence from management and the Company, including compatibility ofnon-audit services with the auditors’ independence. The Audit Committee Report to the Board is at Appendix Apage 78 of this Proxy Statement.
Director Compensation
Objectives of Director Compensation
Qualitynon-employee directors are critical to our success. We believe that the two primary duties ofnon-employee directors are (1) to effectively represent the long-term interests of our shareholders and (2) to provide guidance to management. As such, our compensation program fornon-employee directors is designed to meet several key objectives:
Adequately compensate directors for their responsibilities and time commitments and for the personal liabilities and risks that they face as directors of a public company;
Attract the highest calibernon-employee directors by offering a compensation program consistent with those at companies of similar size, complexity, and business character;
Align the interests of directors with our shareholders by providing a significant portion of compensation in equity and requiring directors to own our stock;
Provide compensation that is simple and transparent to shareholders and reflects corporate governance best practices; and
Where possible, provide flexibility in the form and timing of payments.
Elements of Director Compensation
We believe that the following components of our director compensation program support the objectives above:
We provide cash compensation through retainers for board and committee service, as well as additional cash retainers to the ChairmanChair of the Board and chairpersonschairs of our standing Board committees. We do not provide board and committee meeting fees. Compensation in this manner simplifies the administration of our program and creates greater equality in rewarding service on committees of the Board. The additional retainers compensate directors for the additional responsibilities and time commitments involved with chairperson responsibilities.
| 22 | | Nordson Corporation – 2019 Proxy Statement |
We do not provide board and committee meeting fees. Compensating our directors in this manner simplifies the administration of our program and creates greater equality in rewarding service on committees of the Board. The additional retainers compensate directors for the additional responsibilities and time commitments involved with chair responsibilities. |
All of thenon-employee directors receive annual awards of restricted share units which vest 100% on the last day of the fiscal year.
We pay for, provide, or reimburse directors for expenses incurred to attend Board and committee meetings and director education programs.
Directors do not have a retirement plan but are afforded business travel and accident insurance coverage.
Determining Director Compensation. The Governance and Nominating Committee of the Board provides oversight on director compensation. The Committee oversees, reviews, and reports to the Board on director compensation. The Committee annually reviews competitive market data fornon-employee director compensation and makes recommendations to the Board of Directors with the assistance offor its approval. The Committee is assisted in performing its duties by Exequity LLP (“Exequity”), the Compensation Committee’s independent compensation consultant.
Exequity’s review for fiscal year 2018 consisted of an analysis of competitive market data from a selected peer group of companies. The peer group is consistent with the peer group Exequity used for the executive compensation consultant, reviews the compensation of our non-employee directors. Reviews arereview conducted annually and prior to the commencement of the upcomingduring fiscal year. In benchmarking director compensation, we use the same compensation peer group that is used to benchmark compensation for our named executive officers as described in the Compensation Discussion and Analysis section of this Proxy Statement under the caption “Peer Group and Compensation Surveys.”year 2018.
The components and respective amounts ofnon-employee director compensation for fiscal year 20152018 were:
| Type | Annual Amount ($) | |
• Annual Cash Retainer | | |
• Annual Chair Cash Retainer: | ||
¡ | | |
¡ Audit Committee Chair | | |
¡ Compensation Committee Chair | 10,000 | |
¡ Governance & Nominating Committee Chair | | |
• Annual Equity Award (Restricted Share Units) (1) |
| (1) | The |
|
In August 2015, the Governance and Nominating Committee conducted its annual review of outside director compensation. Based on benchmarking data and the analysis provided by the executive compensation consultant, no changes were made to director compensation for fiscal year 2016.
Annual Cash Retainer. The cash retainers are paid in equal quarterly installments. For directors who are elected byjoin the Board or shareholders after the commencement of a fiscal year, the annual retainer is prorated based on the number of months remaining in the fiscal year. Due to Committee membership changes during fiscal year 2018, the director cash retainers for Messrs. Jaehnert, Keithley, and Merriman were prorated.
Annual Equity Award. Restricted share unitsunit awards are awardedgranted annually on or aboutand are effective the first business day of the fiscal year. The awards vest 100% on the last day of the fiscal year. If a director retires from the Board prior to the vesting date, restricted share units are forfeited on apro-rata basis, based on the number of months served prior to retirement. If a director is elected by the Board or shareholders after the commencement of a fiscal year, the restricted share unit award is prorated based on the number of months remaining in the fiscal year. If restricted share units are not deferred, then the units and accrued dividend equivalents convert to Nordson common shares on aone-for-one basis on the vesting date.
Deferred Compensation Program. Under the directors deferred compensation plan,non-employee directors may defer all or a portion of their annual cash retainer into anon-qualified, unfunded deferred compensation account in the form of deferred cash or share equivalent units. Amounts deferred (i) as cash will earn a return equivalent to the return on an investment in an interest-bearing account, earning interest based on the10-year Treasury bill constant maturity interest rate, or (ii) as share equivalent units will earn a return based on our common share price and accruingaccrued dividend equivalents. We do not pay above market or preferential interest rates under this deferred compensation plan.
Nordson Corporation – 2019 Proxy Statement | | 23 |
Directors may also elect to defer the receipt of restricted share units prior to the awardgrant date. If receipt is deferred, the restricted share units and accrued dividend equivalents will convert to share equivalent units on aone-for-one basis on the vesting date and are not subject to forfeiture.
After retirement from our Board, the share equivalent units and any cash retainers that were deferred as share equivalent units are paid out in our common shares in predetermined quarterly installments over a four yearfour-year period. Any retainer feescash retainers that were deferred as cash, and accrued interest thereon, will be paid out in cash in predetermined quarterly installments over a four yearfour-year period.
Share Ownership Guidelines. The Board believes that ournon-employee directors should have a meaningful ownership interest in the Company and has implemented share ownership guidelines for ournon-employee directors. The ownership guidelines requirenon-employee directors to own a minimum of five times their annual cash retainer in common shares. Shares held in the form of share equivalent units or restricted share units qualify as shares owned under the guidelines. Newly elected directors have five years within which to achieve the share ownership requirement. Allnon-employee directors currently meet the guidelines currently.guideline.
Charitable Gifts Matching Program. Current and retirednon-employee directors may participate in our employeecharitable matching gift program that is available to all current and retired employees. Directors Banks, George, Jaehnert, Keithley, Merriman Jr., Puma, and Richey, Jr. participated in this program in fiscal year 2015. We2018. During fiscal year 2018, we made matching contributions totaling $59,250 for our directors who served in fiscal year 2015.$49,500 under this program.
Indemnity Agreements. We have indemnification agreements for directors in order to attract and retain highly qualified candidates to serve as our directors. The indemnification agreements are intended to secure the protection for our directors contemplated by our Regulations and to the full extent permitted by Ohio law.
Director Compensation Table for Fiscal Year 20152018
The following table sets forth the total compensation of eachnon-employee director for services provided as a director for fiscal year 2015.2018. Due to Committee membership changes the director fees for Messrs. Jaehnert, Keithley, and Merriman were prorated.
Name
| Fees Earned or Paid
| Stock Awards (1)
| All Other
| Total
| Fees Earned or Paid in Cash ($) | Stock Awards (1) ($) | All Other Compensation (2) ($) | Total ($) | ||||||||||||||||
Lee C. Banks | 65,000 | 120,000 | 11,476 | 196,476 |
75,000
|
125,000
|
11,293
|
211,293
| ||||||||||||||||
Randolph W. Carson | 65,000 | 120,000 | 9,976 | 194,976 |
75,000
|
125,000
|
21,077
|
221,077
| ||||||||||||||||
Arthur L. George, Jr. | 65,000 | 120,000 | 10,875 | 195,875 |
75,000
|
125,000
|
18,110
|
218,110
| ||||||||||||||||
Frank M. Jaehnert | 65,000 | 120,000 | 5,330 | 190,330 |
85,112
|
125,000
|
11,238
|
221,350
| ||||||||||||||||
Joseph P. Keithley | 115,000 | 120,000 | 48,123 | 283,123 |
94,551
|
125,000
|
69,724
|
289,275
| ||||||||||||||||
Michael J. Merriman, Jr. | 77,000 | 120,000 | 18,752 | 224,272 | ||||||||||||||||||||
Michael J. Merriman, Jr. (3)
|
120,337
|
125,000
|
42,669
|
288,006
| ||||||||||||||||||||
Mary G. Puma | 75,000 | 120,000 | 17,364 | 212,364 |
85,000
|
125,000
|
9,363
|
219,363
| ||||||||||||||||
Victor L. Richey, Jr. | 70,000 | 120,000 | 18,253 | 208,253 |
83,000
|
125,000
|
24,333
|
232,333
| ||||||||||||||||
| (1) | This column represents the |
| (2) | This column includes the value of dividends on restricted shares, restricted share units, and share equivalent units, premiums for |
| (3) | Mr. Merriman participates in our company-sponsored health care plan under a legacy program which affords health care coverage to anon-employee director on the same terms as our employees. We imputed $17,940 in income to Mr. Merriman for insurance premiums for coverage based on the full COBRA premium value for 2018. No othernon-employee directors participate in this legacy, and now discontinued, program. |
24 | | Nordson Corporation – |
PROPOSAL 2: RATIFY THE APPOINTMENT OF INDEPENDENT
REGISTERED PUBLIC ACCOUNTING FIRM
Appointment of Independent Registered Public Accounting Firm for Fiscal Year Ending October 31, 20162019
Ernst & Young LLP (“EY”) served as our independent registered public accounting firm for the fiscal year ended October 31, 2015.2018. The Audit Committee has appointed EYErnst & Young LLP to serve as our auditors for the fiscal year ending October 31, 2016.2019. Representatives of Ernst & Young LLP are expected to be present at the Annual Meeting, will have an opportunity to make a statement if they so desire, and are expected to be available to respond to appropriate shareholder questions. Although shareholder ratification of the appointment of EYthe independent auditors is not required by law, the Audit Committee and the Board believesof Directors believe that submittingshareholders should be given the appointmentopportunity to ourexpress their views on the subject. While not binding on the Audit Committee or the Board of Directors, the failure of the shareholders for ratification is a matter of good corporate governance. If our shareholders do notto ratify the appointment of EY,Ernst & Young LLP as our independent auditors would be considered by the Board of Directors in determining whether or not to continue the engagement of Ernst & Young LLP. Ultimately, the Audit Committee retains full discretion and will reconsidermake all determinations with respect to the appointment of independent auditors, whether or not our shareholders ratify the appointment.
As provided in the Audit Committee’s charter, the Audit Committee is responsible for directly appointing, retaining, terminating, and overseeing our independent registered public accounting firm. Our Audit Committee continuously evaluates the independence and effectiveness of EYErnst & Young LLP and its personnel, and the cost and quality of its audit and audit-related services.
Pre-Approval of Audit andNon-Audit Services
At the start of each fiscal year, our Audit Committeepre-approves the audit services and audit-related services, if any, together with specific details regarding such services anticipated being required for such fiscal year including, as available, estimated fees. The Audit Committee reviews the services provided to date and actual fees against the estimates and such fee amounts may be updated for presentation at the regularly scheduled meetings of the Audit Committee. Additionalpre-approval is required before actual fees for any service can exceed the originallypre-approved amount. The Audit Committee may also revise the list ofpre-approved services and related fees from time to time. All of the services described below under the captions “Audit Fees” and “Audit-Related Fees” with respect to fiscal years 20142017 and 20152018 were approved in accordance with this policy.
If we seek to engage our independent registered public accounting firm for other services that are not considered subject to general approval as described above, then the Audit Committee must approve such specific engagement as well as the estimated fees. Such engagement will be presented to the Audit Committee for approval at its next regularly scheduled meeting. If the timing of the project requires an expedited decision, then we may ask the chairpersonchair of the Audit Committee to approve such engagement. Any such approval by the chairpersonchair is then reported to the full Audit Committee for ratification at the next Audit Committee meeting. In any event, approval of any engagement by the Audit Committee or the chairpersonchair of the Audit Committee is required before our independent registered public accounting firm may commence any engagement. Additional approval is required before any fees can exceed approved fees for any such specifically-approved services.
Nordson Corporation – 2019 Proxy Statement | | 25 |
Fees Paid to Ernst & Young
The following table shows the fees we paid or accrued for audit and other services provided by EYErnst & Young LLP for the fiscal years ended October 31, 20152018 and October 31, 2014:2017:
| Fiscal Year 2015 | Fiscal Year 2014 | |||||||||||
Services
|
Fiscal Year 2018
|
Fiscal Year 2017
| ||||||||||
Audit Fees (1) | $ | 1,789,607 | $ | 1,588,604 |
$2,204,684
| $1,919,363 | ||||||
Audit-Related Fees (2) | $ | 135,000 | $ | 135,071 |
$ 18,000
|
$ 240,000
| ||||||
Other Fees | $ | 35,000 | — |
$ —
|
$ —
| |||||||
| (1) | Audit services of |
| (2) | Audit-Related Fees generally include fees for employee benefit plans, business acquisitions, accounting consultations, and services related to SEC registration statements. |
RECOMMENDATION REGARDING PROPOSAL 2:
THE BOARD OF DIRECTORS RECOMMENDS THAT YOU VOTE
“FOR” RATIFICATION OF THE
AUDIT COMMITTEE’S APPOINTMENT OF ERNST & YOUNG LLP AS OUR INDEPENDENT
REGISTERED PUBLIC ACCOUNTING FIRM FOR THE FISCAL YEAR ENDING
OCTOBER 31, 2016.2019.
| Nordson Corporation – |
SECURITY OWNERSHIP OF NORDSON COMMON SHARES BY DIRECTORS, DIRECTOR
NOMINEES, EXECUTIVE OFFICERS, AND LARGE BENEFICIAL OWNERS
The following table sets forth the number and percentage of issued and outstanding Nordson common shares beneficially owned as of January 4, 20162, 2019 by directors, and director nominees, each named executive officer, and all directors and executive officers as a group. There were 56,984,39857,609,588 shares of common stock outstanding as of January 4, 2016.2, 2019. The business address for matters related to Nordson for each of our directors, director nominees, and executive officers is 28601 Clemens Road, Westlake, Ohio, 44145.
This beneficial ownership information is based on information furnished by the directors, director nominees, and named executive officers. Beneficial ownership is determined in accordance with Rule13d-3 under the Exchange Act for purposes of this Proxy Statement and is not necessarily to be construed as beneficial ownership for other purposes.
| Name of Beneficial Owner | Total of Shares | Percent of Outstanding Shares | Direct Ownership (1) | Employee Plan (2) | Right to Acquire (3) | Restricted Share Equivalent Units (4) | Total of Shares | Percent of Outstanding Shares | Direct Ownership (1) | Employee Plan (2) | Right to Acquire (3) | Restricted Share Units and Share Equivalent Units (4) | ||||||||||||||||||||||||||||||||||
Lee C. Banks | 10,754 | * | 10,754 | — | — | — |
|
14,735
|
|
*
|
|
14,735
|
|
|
—
|
|
|
—
|
|
|
—
|
| ||||||||||||||||||||||||
Randolph W. Carson | 21,611 | * | 12,093 | — | — | 9,518 |
|
26,786
|
|
*
|
|
12,093
|
|
|
—
|
|
|
—
|
|
|
14,693
|
| ||||||||||||||||||||||||
Arthur L. George, Jr. | 7,697 | * | 4,536 | — | — | 3,161 |
|
11,823
|
|
*
|
|
4,536
|
|
|
—
|
|
|
—
|
|
|
7,287
|
| ||||||||||||||||||||||||
Frank M. Jaehnert | 9,744 | * | 8,228 | — | — | 1,516 |
|
13,773
|
|
*
|
|
12,209
|
|
|
—
|
|
|
—
|
|
|
1,564
|
| ||||||||||||||||||||||||
Joseph P. Keithley | 44,150 | * | 1,518 | — | — | 42,632 |
|
48,010
|
|
*
|
|
—
|
|
|
—
|
|
|
—
|
|
|
48,010
|
| ||||||||||||||||||||||||
Michael J. Merriman, Jr. | 18,043 | * | 2,701 | — | — | 15,342 |
|
22,555
|
|
*
|
|
2,701
|
|
|
—
|
|
|
—
|
|
|
19,854
|
| ||||||||||||||||||||||||
Mary G. Puma | 27,588 | * | 25,194 | — | — | 2,394 |
|
18,829
|
|
*
|
|
16,359
|
|
|
—
|
|
|
—
|
|
|
2,470
|
| ||||||||||||||||||||||||
Victor L. Richey, Jr. | 9,184 | * | — | — | — | 9,184 |
|
13,501
|
|
*
|
|
—
|
|
|
—
|
|
|
—
|
|
|
13,501
|
| ||||||||||||||||||||||||
Michael F. Hilton | 378,710 | * | 20,128 | — | 240,093 | 118,489 |
|
401,350
|
|
*
|
|
24,131
|
|
|
—
|
|
|
233,550
|
|
|
143,669
|
| ||||||||||||||||||||||||
Gregory A. Thaxton | 111,012 | * | 12,497 | 5,671 | 64,725 | 28,119 |
|
130,171
|
|
*
|
|
10,899
|
|
|
8,646
|
|
|
81,625
|
|
|
29,001
|
| ||||||||||||||||||||||||
John J. Keane | 123,597 | * | 30,931 | 872 | 80,300 | 11,494 |
|
127,150
|
|
*
|
|
23,469
|
|
|
897
|
|
|
90,925
|
|
|
11,859
|
| ||||||||||||||||||||||||
Gregory P. Merk | 137,150 | * | 48,558 | 203 | 86,175 | 2,214 |
|
105,495
|
|
*
|
|
41,370
|
|
|
367
|
|
|
59,800
|
|
|
3,958
|
| ||||||||||||||||||||||||
Douglas A. Bloomfield | 82,181 | * | 18,055 | 3,429 | 30,725 | 29,972 | ||||||||||||||||||||||||||||||||||||||||
Directors, nominees and executive officers as a Group (18 persons) | 1,229,422 | 2.16 | % | 259,332 | 17,398 | 646,118 | 306,574 | |||||||||||||||||||||||||||||||||||||||
Jeffrey A. Pembroke
|
|
22,434
|
|
*
|
|
4,544
|
|
|
140
|
|
|
17,750
|
|
|
—
|
| ||||||||||||||||||||||||||||||
Directors, director nominees, and executive officers as a Group (18 persons)
|
|
1,133,365
|
|
1.97%
|
|
215,631
|
|
|
13,616
|
|
|
591,290
|
|
|
312,828
|
| ||||||||||||||||||||||||||||||
| * | Less than 1% |
| (1) | Except as otherwise stated, beneficial ownership of the shares held by each of the directors, director nominees, and executive officers consists of sole voting power and/or sole investment power, or of voting power and investment power that is shared with the spouse of the director, director nominee, or executive officer. |
| (2) | This column shows indirect shares held in our Employee Stock Ownership Plan and 401(k) Plan, for which the individuals indicated have sole voting power and limited investment power. |
| (3) | This column shows shares covered by stock options that currently are exercisable or will be exercisable by March |
| (4) | This column shows the direct share unit ownership held by directors and director nominees, either as deferred ornon-deferred, and executive officers under the deferred compensation plans described in this Proxy Statement. |
Nordson Corporation – | | |
Five Percent Beneficial Owners
The following table lists each person we know to be an owner of more than 5% of our common shares as of January 4, 2016.2, 2019.
| Beneficial Owner | Total Number of Shares | Percent of Outstanding Shares | ||||||
Columbia Wanger Asset Management, LLC (1) | 4,749,100 | 8.3 | % | |||||
Jennifer A. Savage (2) | 4,597,171 | 8.1 | % | |||||
The Vanguard Group, Inc. (3) | 3,901,137 | 6.8 | % | |||||
BlackRock, Inc. (4) | 3,701,725 | 6.5 | % | |||||
Neuberger Berman Group LLC (5) | 3,470,622 | 6.1 | % | |||||
T. Rowe Price Associates, Inc. (6) | 3,300,373 | 5.8 | % | |||||
| Beneficial Owner | Total Number of Shares | Percent of Outstanding Shares | ||||||||
The Vanguard Group, Inc. (1)
|
|
4,560,618
|
|
|
7.9
|
%
| ||||
BlackRock, Inc. (2)
|
|
4,311,022
|
|
|
7.5
|
%
| ||||
Jennifer A. Savage (3)
|
|
4,038,708
|
|
|
7.0
|
%
| ||||
Jane B. Nord (4)
|
|
3,272,213
|
|
|
5.7
|
%
| ||||
| (1) | The information set forth is based solely on the |
The information set forth is based solely on the |
The information set forth is based solely on the |
| (4) | The information set forth is based solely on the Schedule 13G/A filed February 8, 2018 with the SEC by Jane B. Nord, an individual, P.O. Box 457, Oberlin, OH 44074, wherein she reported beneficial ownership of 3,272,213 shares and stated that she has sole voting and investment power over 2,379,677 of the reported shares and shared voting and investment power over 892,536 of the reported shares. According to the Schedule 13G/A, |
We are party to an agreement that, with some exceptions, gives us a right of first refusal with respect to proposed sales of our common shares by certain members of the Nord family and The Nord Family Foundation.
Section 16(a) Beneficial Ownership Reporting Compliance
Section 16(a) of the Exchange Act requires our directors, and executive officers, and persons who ownbeneficial owners of more than ten percent of our outstanding common shares to file reports of beneficial ownership and changes in beneficial ownership of our common shares held by them with the SEC. CopiesSEC, and to furnish copies of thesethose reports must also be provided to us. BasedTo our knowledge, based solely on a review of these reports, we believe that, during the Forms 3, 4, and 5 and amendments thereto with respect to fiscal year ended October 31, 2015,2018, we believe that for the year 2018 all reportsfiling requirements were filedmet on a timely basis by reporting persons.
28 | | Nordson Corporation – |
PROPOSAL 3 —3: ADVISORY VOTE TO APPROVE ON AN ADVISORY BASIS,THE COMPENSATION OF OUR NAMED
EXECUTIVE OFFICERS
During our 20152018 Annual Meeting, we asked our shareholders to approve the compensation of our named executive officers, commonly referred to as a “say-on-pay”“Say-on-Pay” vote. Approximately 98.5%97.7% of shareholder votes cast were in favor of our executive officer compensation program. We value thisthe positive endorsement by our shareholders of our executive compensation policies and believe that the outcome signals our shareholders’ support of our executive compensation program. As a result, our Compensation Committee decided to retain our general approach to named executive officer compensation, with an emphasis on performance-based short and long-term incentive compensation that rewards our most senior executives when they deliver value for our long-term shareholders. At our 2017 Annual Meeting, our shareholders voted in favor of holding our“Say-on-Pay” vote annually, which our Board subsequently approved. Our next shareholder vote on the frequency of our“Say-on-Pay” vote is expected to be held at our 2023 Annual Meeting.
Nordson’s consistent long-term shareholder value creation is attributed to a rigorously-applied management process implemented over the years by successive teams of talented and committed executives. Our executive compensation program underpins and reinforces this process and the performance it generates. We believe the program strikes the appropriate balance between utilizing responsible, measured pay practices and effectively incentivizing our executives to dedicate themselves fully to creating value for our shareholders. In support of this belief, and reflective of the Compensation Committee’s diligent oversight of the executive compensation program, the Compensation Committee urges you to consider the following factors:
WHAT WE DO
| ||
| Pay-for-Performance. A significant portion of executive pay is not guaranteed, but rather tied to key financial and operating measures that are disclosed to our shareholders. For | |
| Committee Independence.Each member of the Compensation Committee meets the independence requirements under SEC rules and | |
| Independent Compensation Consultant. The Compensation Committee engages an independent compensation consultant, Exequity | |
| Peer Group Benchmarking. We review annually our compensation peer group and make adjustments as needed. | |
| Balanced Compensation Structure. We utilize a balanced approach to compensation, which combines fixed and variable, short-term and long-term, and cash and equity compensation. | |
| Total Target | |
| Responsibly Administered Incentive Compensation | |
|
| |
| Capped Award Payouts. Cash payments that can be earned under the Annual Cash Incentive Award, as well as | |
| Consistent Equity Award Policy. Equity awards are made on a consistent schedule and are not made in anticipation of significant developments that may impact the price of our common shares. Similarly, we do not time the release of material,non-public information based on equity award dates. | |
Nordson Corporation – | | 29 |
WHAT WE DO
| ||
| ||
| Include Recoupment and Other Forfeiture Provisions in our Equity and Annual Cash | |
☑ | Share Ownership Guidelines. There are restrictions on sales of vested awards until an executive officer has attained ownership of the Company’s stock as follows: CEO — five times base salary; CFO — three times base salary; and Corporate Executive Vice Presidents — two times base salary. | |
☑ | Equity and Cash Incentive Award Plan Best Practice Features: ☑ Evaluate Share Utilization. We review ongoing awards, forfeitures, overhang levels (dilutive impact of equity compensation on our shareholders), and annual run rates (the aggregate shares awarded as a percentage of total outstanding shares); ☑Double-Trigger forChange-in-Control Severance ☑ Minimum Vesting Period Requirement:We require a minimum vesting period of ☑ Share Repricing. We prohibit repricing of underwater stock options and other awards without shareholder approval; and ☑ No Dividends or Dividend Equivalents on Unearned Performance Share Units. Performance share awards do not earn or pay dividends until the shares are earned, and effective for awards granted after December 27, 2017, dividends and dividend equivalents on time based awards are required to be deferred until vesting of the underlying awards. | |
☑ | Talent Management. We engage in an ongoing, rigorous review of executive talent and succession plans for key operating and corporate roles. | |
WHAT WE DO NOT DO
| ||
☒ | ||
| No Significant Perquisites. | |
☒ | No Above-Market or Preferential Earnings. We do not pay above-market or preferential earnings onnon-qualified deferred | |
☒ | No Hedging, Pledging or Short Sales Transactions Permitted. We prohibit directors and executive officers from pledging Nordson common shares as collateral. Also prohibited | |
☒ | No | |
| ||
We urge you to read the “Compensation“Executive Compensation: Compensation Discussion and Analysis” section below,of the Proxy Statement, which describes in more detail how our executive compensation policies and procedures operate and are designed to achieve our compensation objectives, as well asobjectives. Also, we encourage you to review the Summary Compensation Table and related compensation tables and narrative below that providesof this Proxy Statement, which provide detailed information on the compensation of our named executive officers.
| 30 | | Nordson Corporation – 2019 Proxy Statement |
We are asking our shareholders to indicate their support for compensation paid to our named executive officers as described in this Proxy Statement by voting “FOR” the following resolution at the 20162019 Annual Meeting:
“RESOLVED, that the Company’s shareholders approve, on an advisory basis, the compensation of our named executive officers, as disclosed in the Company’s Proxy
|
Statement for the 20162019 Annual Meeting of Shareholders pursuant to the compensation disclosure rules of the Securities and Exchange Commission, including the Compensation Discussion and Analysis, the executive compensation tables, and the related narrative.”
This advisory resolution, commonly referred to as a “say-on-pay”“Say-on-Pay” resolution, is being presented to our shareholders for a vote pursuant to Section 14A of the Exchange Act and isnon-binding on the Board. Althoughnon-binding, the Board and the Compensation Committee will carefully review and consider the voting results when evaluating our executive compensation program.
RECOMMENDATION REGARDING PROPOSAL 3:
THE BOARD OF DIRECTORS RECOMMENDS THAT, ON AN ADVISORY BASIS, YOU VOTE
“FOR” THE APPROVAL ON AN ADVISORY BASIS,OF
THE COMPENSATION OF OUR NAMED EXECUTIVE OFFICERS.
Nordson Corporation – | | 31 |
EXECUTIVE COMPENSATIONCOMPENSATION:
COMPENSATION DISCUSSION AND ANALYSIS
All references in this Compensation Discussion and Analysis section of the Proxy Statement to “year” or “years” are references tofiscal years unless otherwise noted. Our fiscal year ends October 31.
This Compensation Discussion and Analysis (“CD&A”) describes our executive compensation philosophy and program, the compensation decisions made under this program, and the specific factors we considered in making those decisions. This CD&A focuses on the compensation of our “namednamed executive officers”officers for 2015, those being:2018:
Name
|
Title
| |
Michael F. Hilton | President and Chief Executive Officer | |
Gregory A. Thaxton |
| |
John J. Keane |
| |
Gregory P. Merk |
| |
| Executive Vice President |
This CD&A is presented in sixfive parts:
Part I: Executive Summary. In this section we discuss: (a) highlights of our financial and operating performance that supported, in part, compensation awarded to our named executive officers for 2015;2018; (b) our compensation objectives, including ourpay-for-performance philosophy; (c) Mr. Hilton’s compensation for 2015;2018; and (d) how compensation was tied to performance.
Part II: DeterminingSetting Executive Compensation. In this section we explain our compensation processes and procedures and the roles the Compensation Committee, management, and professional advisorsthe Compensation Committee’s independent compensation consultant have in determiningsetting our executive compensation program.
Part III: Key Components of Our Executive Compensation Program. In this section we provide details of the key components of the compensation we providedpay to our named executive officers, including base salary, annual cash incentive awards,award, long-term incentive awards,award, and other equity-based awards. We also discuss and analyze actions taken with respect to these components in 2015.2018.
Part IV: Other Components of Our Executive Compensation Program. In this section we provide details of other components of the compensation we providedprovide to our named executive officers, including perquisites, welfare and retirement benefits, andchange-in-control benefits.
Part V:Compensation Committee Actions Related to 2016 Executive Compensation. In this section we discuss briefly actions taken during the November 2015 Compensation Committee meeting with respect to the compensation of our named executive officers that will be effective in 2016.
Part VI: Policies Related to Executive Compensation. In this section we review the policies we have adopted that relate to our executive compensation program, including our equity award practices, clawback policy, prohibition against pledging shares or engaging in the hedging of Nordson common shares, and shareholder ownership guidelines for executive officers.
In this CD&A we use the terms “the Committee,” “we,” “us,” and “our” interchangeably in reference to the Compensation Committee, or in the proper context, Nordson Corporation.
This CD&A contains “forward-looking statements” within the meaning of the Private Securities Litigation Reform Act of 1995. These forward-looking statements are subject to certain risks and uncertainties, which could cause actual results to differ materially from the results, performance or achievements expressed or implied thereby. For a detailed discussion of these risks, see Part I, Item 1a.1A. “Risk Factors” and Part II, Item 7. “Management’s Discussion and Analysis of Financial Condition and Results of Operations” in our 20152018 Annual Report. Shareholders should note that statements contained in this CD&A regarding our company and business group performance targets and levelsgoals should not be interpreted as management’s expectations, estimates of results or other guidance.
32 | | Nordson Corporation – |
2015 Corporate2018 Financial and Operating Performance Highlights
2015Fiscal year 2018 was a year of solidstrong financial performance. The tables below present FY2016 – FY2018 reported results for the three primary drivers of incentive compensation for the named executive officers – Diluted Earnings per Share, Return on Total Capital, and operating results in an uncertainRevenue. The Compensation Committee elected to exclude any financial benefits the Company received as a result of the Tax Cuts and low-growth global macroeconomic environment; oneJobs Act that was affected profoundly bypassed in 2017. As a strong U.S. Dollar:
Sales of $1.69 billion,result, all calculations for executive compensation in this section, except for the graph below (see footnote), exclude the financial benefit to the Company as a 1% decrease over FY 2014, including 6% total volume growth and negative currency translation effects of 7%.
Gross margin was 54%, factoring in negative currency translation; a continued strong level that ranks among the highest for diversified industrial machinery companies.
Operating profit was $318 million.
Operating margin was 19%, factoring in negative currency translation and inclusive of charges related to non-recurring items.
Diluted earnings per share were $3.45, inclusive of $0.12 in charges related to non-recurring items and negative currency translation of $.54 per share.
Free cash flow* before dividends was $200 million or 95% of net income.
Net debt at the endresult of the year was 2.8 times trailing-four quarters EBITDA.
Dividends paid for the year were $55 million. We increased our quarterly dividend by 9%, marking the 52nd consecutive year we have increased our dividend.
We invested $382 million during the year to purchase approximately 9% of our outstanding shares, offsetting the dilutive effect of benefits programsTax Cuts and buying additional shares opportunistically.
Over the past five years we have purchased 19% of Nordson’s outstanding shares at an average price of $61.70 per share, at a discount of approximately 13% compared to the 2015 year-end closing price of $71.24 per share.
We completed three acquisitions within the strategic and targeted spaces we have previously identified: Liquidyn, GmbH in the fluid management space, WAFO Produktions GmbH in the polymer processing operating unit and MatriX Technologies, GmbH in the test and inspection space.
| | |
| * | This data includes the benefits inured to the Company from the Tax Cuts and Jobs Act that was passed in 2017. The Company’s 2018 data, excluding the benefits from the Tax Cuts and Jobs Act and utilizing a more normalized effective tax rate, are: Diluted Earnings per Share is $5.70 and Return on Total Capital is 14%. |
Compensation Objectives
We provide a straightforward, uncomplicated compensation structure for our named executive officers, one which is designed to support three primary objectives:
Objective
|
How Objective is Achieved
| |
Alignment with Shareholder Interests |
A substantial portion of our executive compensation program is provided in the form ofequity-based long-term awards, which directly tie to share price appreciation.
We impose share ownership requirements, which encourage our executives to maintain a meaningful equity interest in the Company.
| |
Pay-for-Performance |
Our incentive awards are based on performance against a balanced mix of long-standing, consistent andpre-established financial measures as well as quantitative operating performance measures.
| |
Talent Retention |
Total direct compensation opportunities generally are targeted to approximate the median of the peer group that we compete with for talent.
The vesting periods for equity-based compensation (performance share units, stock options and restricted shares) support this objective. |
Nordson Corporation – 2019 Proxy Statement | | 33 |
Mr. Hilton’s Compensation
The compensation paid to our Chief Executive Officer, Mr. Hilton, is consistent with our “pay-for-performance”“pay-for-performance” compensation philosophy that applies to all of our named executive officers. Considering Mr. Hilton’s tenure, experience, and performance, his total target total direct compensation is designed to approximateapproximates the target total direct compensation75th percentile of other chief executive officers in our peer group and hisgroup. Mr. Hilton’s actual annual and long-term incentive awards are aligned with our earnings per share growth, revenue growth and return on total capital.capital, and revenue growth.
During its November 24, 201420, 2017 meeting, the Compensation Committee, with input from its independent executive compensation consultant, Exequity LLP, established Mr. Hilton’s 20152018 total target direct compensation, taking into account a number of factors, including a competitive market review, tenure and experience, relative internal pay equity, the Board’s assessment of Mr. Hilton’s multi-year performance, and the Company’s overall financial and operating performance:
|
Value
| |
Base Salary | $ | |
Annual Cash Incentive Award Target Opportunity | $ | |
2018-2020 Performance Share Incentive Award Target Opportunity | 13,400 share units $1,654,230 grant date fair | |
Stock Options | 55,800 shares $1,942,599 grant date fair | |
Restricted Shares | 6,700 shares $855,389 grant date fair |
The combination of target payoutspayout opportunity for the Annual Cash Incentive Award and Performance Share Incentive Award plus the awardgrant date fair value of restricted share and stock option awards represented approximately 83%85% of Mr. Hilton’s target total direct compensation for 2015,2018, which further reinforces ourpay-for-performance culture.
|
During its November 23, 201526, 2018 meeting, shortly after our 20152018 fiscal year ended, the Board reviewed Mr. Hilton’s performance for 2015.2018. In assessing Mr. Hilton’s performance, the Board considered:considered Mr. Hilton’s impact on the Company’sone-year operating plan and longer-term strategic plans. The Board concluded that Mr. Hilton delivered outstanding performance with respect to both his short and long-term goals. In particular, the Board noted the following:
The Company’s strong financial and operating results in an uncertainperformance, including achieving multiple record financial metrics, and low-growth global macroeconomic environment, wheretop percentile performance among the U.S. Dollar strengthened dramatically and had a profound negative impact upon our results;peer group companies;
Mr. Hilton’s leadership of the Company, specifically the progress made toward strengthening the Company’s overall long-term growth profile through organic initiatives, acquisitions, and driving continuous improvement through the global organization; and
Mr. Hilton’s strong emphasisContinued development and execution on global development of the Company’ssenior leadership and management capabilities.succession plans.
With input fromBased on the entire BoardBoard’s assessment and reflective of the considerationsperformance noted above, the Compensation Committee, without Mr. Hilton present during its deliberations, and consistent with its “pay-for-performance”“pay-for-performance” philosophy, confirmed the performance levels for the pre-established financial and operating performance measures and took the following actions with respect to Mr. Hilton’s 20152018 incentive compensation:
Incentive Award
|
Payout
|
Percent of Target
| ||
2018 Annual Cash Incentive | $1,082,250 | 117.0% | ||
2016-2018 Performance Share Incentive
| 34,095 shares(1)
| 185.3%
|
| (1) | Settlement of the Performance Share Incentive Award occurred on January 3, 2019. Based on the closing price of our common shares on January 3, 2019 ($112.76 per share), value of the payout in dollars was $3,844,552. |
|
| |
| ||
|
|
Except for excluding the financial benefits the Company received from the Tax Cuts and Jobs Act, no discretion was exercised by the Compensation Committee to increase or decrease the formulaic incentive award payouts to Mr. Hilton.
How Compensation is TiedCorrelates to Performance
Our executive compensation program is structured so that a significant portion of the compensation paid to our named executive officers is dependent upon the performance of our business. The program is not overly weighted toward cash incentive compensation and does not otherwise have the potential to threaten long-term shareholder value by promoting unnecessary or excessive risk-taking by our executive officers.
For thoseincentive compensation awards that are based on the Company’s performance, our specific decisions around setting performance measures and levelsgoals and other actions impacting executive compensation focus on certain areas that are tied directly to our business plan and are what we believe are the most critical value drivers of the business, such as revenue and earnings growth and return on total capital.
The Annual Cash Incentive Award payout is tied to diluted earnings per share growth and return on total capital. The Performance Share Incentive Award payout is based on cumulative diluted earnings per share growth and cumulative revenue growth over a three-year period. The Performance Share Incentive Award payout is also impacted by share price performance, as the payout value (in dollars) is based on the settlement date share price.
Nordson Corporation – | | 35 |
The graph below compares Nordson’s total shareholder return* for the fiveten year period endingended October 31, 20152018 with that of the S&P 500 Index, the S&P MidCap 400 Index, S&P 500 Industrial Machinery Index and the S&P MidCap 400 Industrial Machinery Index, and the median return of our peer group companies (assuming the reinvestment of all dividends).
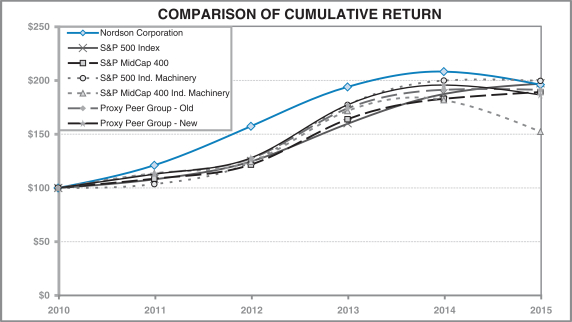
COMPARISON OF CUMULATIVE RETURN
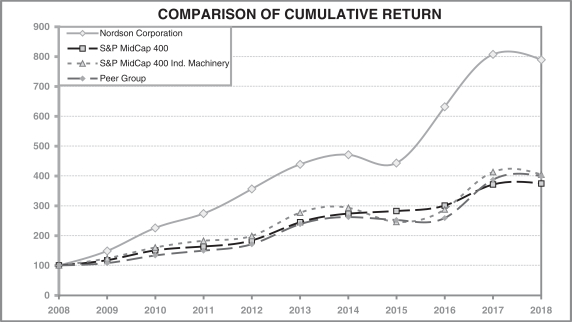
| * | We define Total Shareholder Return (“TSR”) as: (share price end of period |
The 2015 peer group included two companies that were no longer independent companies for the entirety of our fiscal year — GrafTech International Ltd. and Pall Corporation. To reflect more accurately our 2015 TSR against the compensation peer group, we have provided two compensation peer groups — “Peer Group Old,” which includes GrafTech International Ltd.’s and Pall Corporation’s TSR through the date they ceased to be public companies, and “Peer Group New,” which excludes these two former public companies.
ASSUMES $100 INVESTED ON NOVEMBER 1, 20102008
ASSUMES DIVIDENDS REINVESTED
FISCAL YEAR ENDINGENDED OCTOBER 31, 20152018
Company/Market/Peer Group
|
2010
|
2011
|
2012
|
2013
|
2014
|
2015
| 2008 | 2009 | 2010 | 2011 | 2012 | 2013 | 2014 | 2015 | 2016 | 2017 | 2018 | |||||||||||||||||||||||||||||||||||||||||||||||||||
Nordson Corporation | $ | 100.00 | $ | 121.14 | $ | 157.44 | $ | 194.09 | $ | 208.21 | $ | 196.14 | $ | 100.00 | $ | 149.23 | $ | 226.27 | $ | 274.10 | $ | 356.22 | $ | 439.17 | $ | 471.10 | $ | 443.80 | $ | 632.04 | $ | 807.21 | $ | 788.83 | ||||||||||||||||||||||||||||||||||
S&P 500 Index | $ | 100.00 | $ | 108.09 | $ | 124.52 | $ | 159.73 | $ | 187.31 | $ | 197.05 | ||||||||||||||||||||||||||||||||||||||||||||||||||||||||
S&P MidCap 400 | $ | 100.00 | $ | 108.55 | $ | 121.69 | $ | 163.77 | $ | 182.85 | $ | 189.11 | $ | 100.00 | $ | 118.18 | $ | 150.84 | $ | 163.74 | $ | 183.57 | $ | 245.03 | $ | 273.58 | $ | 282.95 | $ | 300.65 | $ | 371.23 | $ | 375.02 | ||||||||||||||||||||||||||||||||||
S&P 500 Ind. Machinery | $ | 100.00 | $ | 103.46 | $ | 123.82 | $ | 177.22 | $ | 199.84 | $ | 199.54 | ||||||||||||||||||||||||||||||||||||||||||||||||||||||||
S&P MidCap 400 Ind. Machinery | $ | 100.00 | $ | 113.73 | $ | 124.21 | $ | 171.63 | $ | 181.87 | $ | 152.24 | $ | 100.00 | $ | 123.61 | $ | 160.67 | $ | 182.73 | $ | 199.57 | $ | 277.07 | $ | 293.61 | $ | 245.77 | $ | 288.44 | $ | 413.70 | $ | 404.98 | ||||||||||||||||||||||||||||||||||
Proxy Peer Group — Old | $ | 100.00 | $ | 112.91 | $ | 127.36 | $ | 173.88 | $ | 191.31 | $ | 191.34 | ||||||||||||||||||||||||||||||||||||||||||||||||||||||||
Proxy Peer Group — New | $ | 100.00 | $ | 112.76 | $ | 127.85 | $ | 177.26 | $ | 195.68 | $ | 186.50 | ||||||||||||||||||||||||||||||||||||||||||||||||||||||||
Peer Group | $ | 100.00 | $ | 108.45 | $ | 133.57 | $ | 150.02 | $ | 171.39 | $ | 238.19 | $ | 262.44 | $ | 252.27 | $ | 259.27 | $ | 388.10 | $ | 399.03 | ||||||||||||||||||||||||||||||||||||||||||||||
Source: Zack’s Investment Research
We place significant emphasis on long-term growth in our share price, and believe the information provided in the graph and tables above to be important in understanding our compensation philosophy and its role in the achievement of our long-term objectives.
36 | | Nordson Corporation – |
PART II: DETERMININGSETTING EXECUTIVE COMPENSATION
Role of the ShareholderSay-on-Pay Vote
The Committee believes that the results of the advisory “say-on-pay”“say-on-pay” shareholder vote represent an affirmation of our current pay practices and philosophies and, as a result, no significant changes were made to our executive compensation pay practices for 2015.2018. The Committee will continue to consider the outcome of thesay-on-pay vote when making future compensation decisions for the named executive officers. The results of oursay-on-pay vote for the past fourfive years are as follows:
Annual Meeting Year |
FOR Vote (%)
|
FOR Vote (%)
| |||||||
2012 | 94.63 | ||||||||
2013 | 97.13 | ||||||||
2014 | 97.90 | 97.90 | |||||||
2015
|
| 98.50
|
| 98.50 | |||||
2016 | 98.97 | ||||||||
2017 | 98.11 | ||||||||
2018 | 97.70 | ||||||||
At the 2017 Annual Meeting, the Company’s shareholders voted in favor of an annual frequency for holding our“say-on-pay” vote, which the Board subsequently approved. The next shareholder vote on the frequency of our advisory“say-on-pay” vote is expected to be held at our 2023 Annual Meeting.
Role of the Compensation Committee
The Committee is made up entirely of independent directors as defined by our Governance Guidelines and NASDAQNasdaq listing standards and has responsibility for establishing our executive compensation program and for making compensation decisions under the program. In fulfilling its duties and responsibilities for 2015,2018, the Committee sought input, advice, and recommendations from an independent executive compensation consultant as well as recommendations from our Chief Executive Officer, Mr. Hilton. At all times, however, wethe Compensation Committee exercised independent judgment in making executive compensation decisions.
Role of the Executive Compensation Consultant
The Committee retained Exequity Inc.LLP (“Exequity”) as the executive compensation consultant reporting directly to the Committee. Exequity provides research, data analyses, survey information, and design expertise in developing compensation programs for our executive officers. In addition, Exequity informs the Committee of regulatory developments and market trends related to executive compensation practices. The Committee has assessed the independence of Exequity in light of SEC rules and NASDAQNasdaq listing standards and concluded that no conflict of interest would prevent Exequity from independently and objectively advising the Committee.
Role of Executive Management
Mr. Hilton and Ms. Shelly Peet, Executive Vice President, Human Resources & Information Systems, provide additional information and analysis as requested by the Committee. More specifically, Mr. Hilton and Ms. Peet provided support for Committee meetings and made recommendations about designs for and, if warranted, changes to our Annual Cash Incentive Award and long-term equity-based awards. In addition to the responsibilities above, Mr. Hilton also: (a) provided to the entire Board of Directors a self-assessment of his performance for the fiscal year; (b) provided an assessment of each executive officer’s performance; and (c) recommended annual base salary adjustments, payout levels under thepayouts of Annual Cash Incentive AwardAwards and Performance Share Incentive Award,Awards, and equity awards for executive officers other than himself.
Nordson Corporation – 2019 Proxy Statement | | 37 |
Setting Goals and Compensation
In order to focus on delivering growth and value for shareholders over time and to communicate consistently with investors and other stakeholders, we take a longer term approach to incentive compensation wherein our incentive plan targets remain consistent for a multi-year period of time, which is more aligned with our five year strategic plan cycle. We annually assess measures and performance goals (threshold, target, and maximum) to validate they are set appropriately based on internal and external factors, such as historic peer performance, long-term growth projections for Nordson, our own past and current performance, and market conditions and expectations.
The most heavily weighted component of our annual review of incentive goals is the historical performance of our peers, particularly our proxy peers, though we also review a group ofmid-cap industrial peers for reference. For each corporate measure, we review theone-, three-, and five-year median performance of our peers in comparison to our performance goals. In general, if our performance goals fall outside a corridor around the median peer performance for two consecutive years, we further evaluate the appropriateness of our goals.
Using two consecutive years outside our range of peer median performance for a metric as our guideline, we complete a full review to determine whether we should make a change. We look at additional internal and external data to develop our recommendation.
Nordson expected future performance based on our five-year strategic plan: This allows us to assess whether our future expected performance continues to align with existing incentive targets and therefore would indicate that our goals should stayas-is, or whether our five-year plan expected performance projections are more in line with the movement in peer performance, and suggest we consider an adjustment.
Nordson historic performance: Our historic performance is reviewed along with projected future performance to help us assess whether we believe targets should be changed.
Other external factors: Consideration of economic conditions, investor and shareholder expectations, pay for performance alignment, and other factors also contribute to our final recommendation as to whether or not our target should be adjusted.
Based on a qualitative analysis of all factors, and considering input from the independent executive compensation consultant, the Compensation Committee may change goals or to retain the targets currently in place.
| 38 | | Nordson Corporation – 2019 Proxy Statement |
Peer Group and Compensation Surveys
Our compensation peer group for 2015,2018, which was developed in consultation with Exequity, consisted of the 2018 publicly-traded companies listed below. The Committee believes the listed peer companies serve as the appropriate peer group because they have revenues generally within the range of .5x –0.5x — 2.0x Nordson’s revenue; a global scope and business complexity; a focus on precision industrial manufacturing; innovation and technology; global growth strategies; and profiles or business models
similar to Nordson’s, based on industries or diverse markets served. The Committee regularly reviews the peer group and makes appropriate modifications from time to time so that the group closely resembles our competitive market for executive talent. In determining any changes, the Committee considers numerous financial measures and Nordson’s position relative to the proposed peer companies.
Company
|
Revenue
|
Market Cap
|
Revenue*
|
Market Cap As of Dec. 2017
| ||||||||||||
Actuant Corporation
| $
| 1,400
|
| $
| 1,724
|
| $
| 1,096
|
| $
| 1,517
|
| ||||
Albany International Corp.
| $
| 745
|
| $
| 1,087
|
| $
| 864
|
| $
| 1,976
|
| ||||
AMETEK Inc.
| $
| 4,022
|
| $
| 12,943
|
| $
| 4,300
|
| $
| 16,749
|
| ||||
Barnes Group Inc.
| $
| 1,262
|
| $
| 2,015
|
| $
| 1,436
|
| $
| 3,392
|
| ||||
Chart Industries Inc.
| $
| 1,193
|
| $
| 1,042
|
| $
| 989
|
| $
| 1,442
|
| ||||
CLARCOR Inc.
| $
| 1,513
|
| $
| 3,340
|
| ||||||||||
Donaldson Company, Inc.
| $
| 2,473
|
| $
| 5,304
|
| $
| 2,372
|
| $
| 6,359
|
| ||||
Entegris, Inc.
| $
| 962
|
| $
| 1,843
|
| $
| 1,343
|
| $
| 4,306
|
| ||||
Esterline Technologies Corp.
| $
| 2,051
|
| $
| 3,482
|
| $
| 2,002
|
| $
| 2,220
|
| ||||
FLIR Systems, Inc.
| $
| 1,531
|
| $
| 4,552
|
| $
| 1,800
|
| $
| 6,460
|
| ||||
Graco Inc.
| $
| 1,221
|
| $
| 4,768
|
| ||||||||||
GrafTech International Ltd.
| $
| 1,085
|
| $
| 690
|
| ||||||||||
Graco, Inc.
| $
| 1,475
|
| $
| 7,615
|
| ||||||||||
IDEX Corporation
| $
| 1,954
|
| $
| 3,846
|
| $
| 2,287
|
| $
| 10,083
|
| ||||
ITT Corporation
| $
| 2,655
|
| $
| 3,706
|
| $
| 2,585
|
| $
| 4,697
|
| ||||
Keysight Technologies, Inc.
| $
| 3,189
|
| $
| 7,791
|
| ||||||||||
Lincoln Electric Holdings, Inc.
| $
| 2,813
|
| $
| 4,044
|
| $
| 2,624
|
| $
| 6,022
|
| ||||
Pall Corporation
| $
| 2,789
|
| $
| 10,782
|
| ||||||||||
Roper Industries, Inc.
| $
| 3,552
|
| $
| 15,660
|
| ||||||||||
Roper Technologies, Inc.
| $
| 4,607
|
| $
| 26,512
|
| ||||||||||
Teradyne, Inc.
| $
| 1,648
|
| $
| 4,284
|
| $
| 2,137
|
| $
| 8,213
|
| ||||
Watts Water Technologies Inc.
| $
| 1,514
|
| $
| 1,818
|
| ||||||||||
Watts Water Technologies, Inc.
| $
| 1,457
|
| $
| 2,594
|
| ||||||||||
Woodward, Inc.
| $
| 2,001
|
| $
| 3,211
|
| $
| 2,099
|
| $
| 4,688
|
| ||||
75th Percentile | $ | 2,514 | $ | 5,367 | $
| 2,532
|
| $
| 7,747
|
| ||||||
Average | $ | 1,977 | $ | 4,737 | $
| 2,148
|
| $
| 6,813
|
| ||||||
Median | $ | 1,648 | $ | 3,706 | $
| 2,050
|
| $
| 5,359
|
| ||||||
25th Percentile
| $
| 1,262
|
| $
| 1,843
|
| $
| 1,442
|
| $
| 2,793
|
| ||||
Nordson Corporation
| $
| 1,700
|
| $
| 4,850
|
| $
| 2,067
|
| $
| 8,454
|
| ||||
| * | Revenue |
The 2014 peer group included two companies that were no longer independent companies at the time we set executive compensation for 2015: Gardner Denver, Incorporated and Robbins & Myers, Inc. Veeco Instruments Incorporated was also removed as its revenues fell below the revenue target range (.5x – 2.0x) for our peer companies. In their stead and upon advice from Exequity, we added ITT Corporation, Pall Corporation and Teradyne, Inc. as peer companies. FollowingPrior to the date 2015that 2018 compensation was set, GrafTech International Ltd.CLARCOR, Inc. was acquired by Parker-Hannifin (NYSE: PH) and Pall Corporationit ceased to be an independent public entities. The Committee, with inputentity and was removed from Exequity, added Keysight Technologies, Inc. to theour peer group for setting fiscal year 2016 executive compensation.
group. Where peer group proxy data was not available, and as a reference and a primary source of data for the functional leaders, we utilized survey data published by Aon Hewitt for the position or positions that most closely match the job description of each named executive officer or executive officer position.
Nordson Corporation – | | |
Allocation of Executive Compensation
Our executive compensation program does not prescribe a specific formula for the mix of base salary and annual and long-term incentive components so that we have flexibility in developing an appropriate compensation mix. Generally, we set the target total direct compensation for our named executive officers to approximate the median for our peer group companies, taking into account the experience level of the individuals in their current positions and internal pay equity. Within the total direct compensation opportunity for any executive officer, individual components of compensation may be greater or lesser than the median because the Committee’s focus is on the competitiveness of the entire compensation package versus any one element of compensation. With respect to actual compensation delivered, the majority of the other compensation components are dependent upon how well the Company performs and the performance of Nordson common shares.
The table below reflects the approximate allocation mix at target among the three elements of total target total direct compensation –— base salary, Annual Cash Incentive Award opportunity, and long-term equity-based incentive award opportunity –— for our named executive officers at the time we set compensation for 2015:2018:
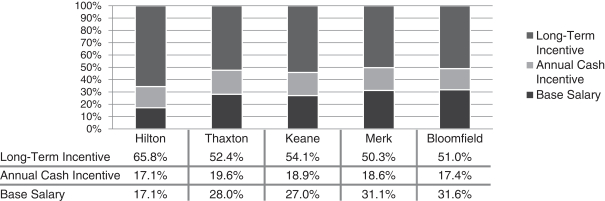
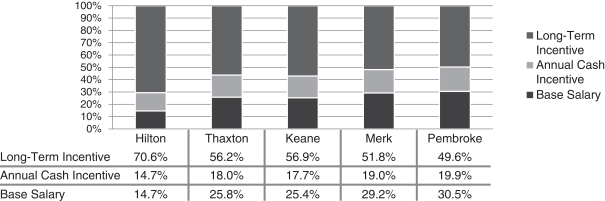
Hilton Thaxton KeaneMerkPembrokeLong-Term Incentive70.6%Annual Cash Incentive 14.7%Base Salary 14.7%56.2%18.0%25.8%56.9%17.7%25.3%51.8%19.0%29.2%49.6%19.9%30.6%
85% of the total direct compensation for Mr. Hilton and approximately 69% - 75% for the other named executive officers is delivered through awards that link pay to financial and operational performance. Incentive payouts under our Annual Cash Incentive Award are based on growth in diluted earnings per share, return on capital, and operating unit results. Equity-based compensation consists of performance share units,non-qualified stock options, and service-based restricted shares, all of which align compensation with the long-term interests of our shareholders.
| 40 | | Nordson Corporation – 2019 Proxy Statement |
PART III: KEY COMPONENTS OF OUR EXECUTIVE COMPENSATION PROGRAM
The table below summarizes the components and objectives of our 20152018 compensation program for executive officers, including our named executive officers, and the actions taken by the Compensation Committee relative to each component and the named executive officers.component.
Component
|
Link to Compensation
|
| ||
Base Salary Fixed cash element of total direct compensation. |
|
| ||
Annual Cash Incentive Award Cash payments tied to year-over-year growth in earnings per share and return on total capital. |
|
| ||
Long-Term Incentive Awards Includes performance share units, stock options, |
|
|
Below in graphic presentation is a depiction of the elements of the pay components discussedoutlined above. A detailed discussion of these elements is found under the captions “Key Components of Our Executive Compensation Program” and “Other Components of Our Executive Compensation Program” in Parts III and IV of this Compensation Discussion and Analysis, respectively.
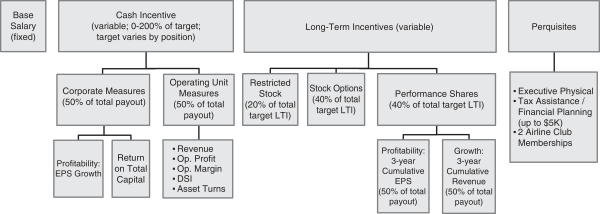
Base Salary (fixed)Cash Incentive (variable; 0-200% of target; target varies by position)Long-Term Incentives (variable)PerquisitesCorporate Measures (50% of total payout)Operating Unit Measures (50% of total payout)Restricted Stock (20% of total target LTI)Stock Options (40% of total target LTI)Performance Shares (40% of total target LTI)Executive Physical Tax Assistance / Financial Planning (up to $5K) 2 Airline Club MembershipsProfitability: EPS GrowthReturn on Total CapitalRevenue Op. Profit Op. Margin DSI Asset TurnsProfitability: 3-year Cumulative EPS (50% of total payout)Growth: 3-year Cumulative Revenue (50% of total payout)
Base Salary
The Committee determines annually the base salaries of our executive officers, including whether to award base salary increases from the previous year and, if so, the magnitude (%) of the increase, based on the following factors: (i)
level of experience and responsibility; (ii) company,
Company, business segment, and individual performance during the prior year; (iii)
Nordson Corporation – 2019 Proxy Statement | | 41 |
market and survey data; (iv)
internal pay equity; (v)
the Committee’s assessment of other elements of compensation provided to the executive officer; and (vi)
our Chief Executive Officer’s recommendation for all executive officers other than himself.
20152018 Actions and Analysis
Considering Exequity’s input and analysis and the recommendations of our Chief Executive Officer, we set individual base salaries of our named executive officers for 20152018 at a level consistent with the general objective of paying total target direct compensation to approximate the median of our peer group.group; however, each executive officer’s position relative to median may vary depending on a consideration of factors such as tenure, experience, future potential, internal pay equity, and performance.
The following table reflects the annualized base salaries of our named executive officers for 20152018 and 2014 2017(year-end):
Name
|
Base Salary 2015 ($)
|
Base Salary
|
Increase in Base
|
Base Salary
|
Base Salary
|
Increase in Base Salary (%)
| |||||||||||||||||||||
Michael F. Hilton
|
| 825,000
|
|
| 800,000
|
|
| 3.1
|
|
| 925,000
|
|
| 875,000
|
|
| 5.7
|
| |||||||||
Gregory A. Thaxton
|
| 420,000
|
|
| 390,000
|
|
| 7.7
|
|
| 470,000
|
|
| 450,000
|
|
| 4.4
|
| |||||||||
John J. Keane
|
| 405,000
|
|
| 380,000
|
|
| 6.6
|
|
| 455,000
|
|
| 435,000
|
|
| 4.6
|
| |||||||||
Gregory P. Merk
|
| 345,000
|
|
| 320,000
|
|
| 7.8
|
|
| 420,000
|
|
| 403,000
|
|
| 4.2
|
| |||||||||
Douglas C. Bloomfield
|
| 320,000
|
|
| 290,000
|
|
| 10.3
|
| ||||||||||||||||||
Jeffrey A. Pembroke
|
| 415,000
|
|
| 403,000
|
|
| 3.0
|
| ||||||||||||||||||
|
Annual Cash Incentive Award
Purpose
The purpose of the Annual Cash Incentive Award is to drive high-performance results year-over-year based on the achievement ofpre-established quantitative performance levelsgoals which focus our executives on key business strategies and align the interests of our executive officers with our shareholders. Through the Annual Cash Incentive Award, executive officers are provided the opportunity to earn a significantly higher cash payout if target performance is exceeded but bear the risk of a lower cash payout if target performance is not achieved, and no payout if threshold performance is not achieved.
Measures
Performance and payouts under the Annual Cash Incentive Award are determined based on quantitative corporate financial measures –— diluted earnings per share growth and return on total capital –— and quantitative operating measures. For namedAs noted above, the Compensation Committee voted to exclude from the executive officers that have responsibility for certain corporate functions (including our Chief Executive Officer and Chief Financial Officer), the corporate financial measures account for 50% of any payout with a weighted averagecompensation analysis, including calculation of the business unit quantitative operating measures accounting for2018 annual incentive awards, all financial benefits the other 50%Company received as a result of the payout. For the operating named executive officers, the corporate financial measures account for 50% of any payout with the respective business quantitative operating measures accounting for the other 50% of the payout.
The Committee, after considering a number of factors, including peerTax Cuts and survey group practices and receiving input from Exequity, determined that management should be held accountable for some, but not all, of the impact of currency fluctuation on corporate financial and operating measures. Accordingly,Jobs Act passed in determining Cash Incentive Award payouts, the Committee has adopted a policy whereby management will be held accountable for the first 10% of the impact on payouts due to currency fluctuation. Under the policy, total payout rates are calculated at actual currency rates and currency neutral rates for the U.S. Dollar during the fiscal year. The final payout reflects a currency adjustment equal to the difference between these two payout rates less 10%.2017.
For example, if the difference between the two payout rates is equal to or less than +/- 10 percentage points, the final payout rate will be based on the actual currency rates, with no adjustment. When the payout rate at actual currency rates is more than 10 percentage points lower than the payout rate at currency neutral rates, the final payout rate will be based on the payout rate at currency neutral rates adjusted downward by 10 percentage points. Conversely, when the payout rate at actual currency rates is more than 10 percentage points higher than the payout at currency neutral rates, the final payout rate will be based on the payout rate at currency neutral rates adjusted upward by 10 percentage points.
We believe this policy is appropriate because it requires management to respond to currency fluctuations within a specified range. However, it does not unfairly benefit or harm management if currency impact is beyond what may be considered normal and which is not under management’s control.
We intend payouts under the Cash Incentive Award to be deductible for federal income tax purposes under Section 162(m) of the Internal Revenue Code. In order to achieve this, we establish a Cash Incentive Award payout pool and a maximum payout amount from the pool for each named executive officer subject to Section 162(m). Under the terms of the shareholder-approved 2012 Stock Incentive and Award Plan, the maximum permitted payout to any executive officer is $5,000,000. The Committee has the authority to decrease payouts below the maximum payout amount (e.g., exercise “negative discretion”) but may not increase payouts above this maximum amount.
2015 Actions and Analysis
Setting the Cash Incentive Award payout opportunities and determining payouts is a multi-step process. For 2015, we considered Exequity’s analysis of the peer group annual incentive opportunities and set a target payout opportunity for our executive officers as well as the threshold and maximum payout opportunity as a percentage of annualized base salaries. No changes were made to the target annual incentive opportunities for our named executive officers from 2014 levels except for Messrs. Thaxton and Merk who each received a 5% increase to their target opportunity based on the same
factors and analysis described under the above “Base Salary” discussion. The following table reflects the payout opportunities at the respective performance levels, as a percentage of base salary:
| Incentive Amount as a Percentage (%) of Base Salary | ||||||||||||
Name
|
Threshold
|
Target
|
Maximum
| |||||||||
Michael F. Hilton
|
| 50
|
|
| 100
|
|
| 200
|
| |||
Gregory A. Thaxton
|
| 35
|
|
| 70
|
|
| 140
|
| |||
John J. Keane
|
| 35
|
|
| 70
|
|
| 140
|
| |||
Gregory P. Merk
|
| 30
|
|
| 60
|
|
| 120
|
| |||
Douglas C. Bloomfield
|
| 27.5
|
|
| 55
|
|
| 110
|
| |||
During our November 2014 meeting, we first set the Section 162(m) Cash Incentive Award payout pool at 1.5% of the Company’s cash flow from operating activities, as disclosed in our 2015 Form 10-K Report, and a maximum payout from the pool for Section 162(m) participants: Mr. Hilton – 55% and Messrs. Keane, Merk and Bloomfield – 15% each. We then established quantitative corporate financial performance measures for the Cash Incentive Award, which measures account for 50% of Cash Incentive Award payout (if any):
Measure
|
Threshold
|
Target
|
Maximum
|
Weighting
| ||||
Diluted Earnings Per Share Growth | 0% | 10% | 20% | 50% | ||||
Return on Total Capital | 8.0% | 11.5% | 16% | 50% |
We consider diluted earnings per share growth and return on total capital to be measures critical to our success. We believe these measures offer the proper balance between growth and profitability. We also believe that achieving greater return on total capital and earnings per share growth over time will drive improved shareholder return and foster maximum value for our assets. More specifically:
Diluted earnings per share growth measures the rate at which management has succeeded in increasing the profits per unit of ownership by shareholders. Earnings per share growth is easily compared among peers and the measure is commonly used by the investment community to evaluate performance. The formula we utilize for diluted earnings per share is net income divided by weighted average common diluted shares outstanding.
| 42 | | Nordson Corporation – 2019 Proxy Statement |
by weighted average common diluted shares outstanding. For this year’s calculations, we utilized a more normalized effective tax rate in calculating the diluted earnings per share and excluded the benefits of the Tax Cuts and Jobs Act. |
Return on total capital measures the amount of profitability per unit of capital invested by management to generate earnings. We have adopted a definition of return on total capital that is consistent with financial disclosure in our Report on Form 10-K Report:10-K: the sum of net income (loss) plusafter-tax interest expense on debt as a percentage of the sum of average of quarterly debt (net of cash) plus average quarterly shareholders’ equity over five accounting periods.
For named executive officers that have responsibility for certain corporate functions (including our Chief Executive Officer and Chief Financial Officer), the corporate financial measures account for 50% of any payout with a weighted average of the business unit quantitative operating measures accounting for the other 50% of the payout. For the operating unit named executive officers, the corporate financial measures account for 50% of any payout with the respective operating unit’s quantitative operating measures accounting for the other 50% of the payout.
Effect of Currency Fluctuation
The Committee, after considering a number of factors, including peer and survey group practices and receiving input from Exequity, has determined that management should be held accountable for some, but not all, of the effect of currency fluctuation on corporate financial and operating unit performance results. Accordingly, in determining Annual Cash Incentive Award payouts, the Committee adopted a policy whereby management will be held accountable for the first 10% of the impact on payouts due to currency fluctuation. Under the policy, payout rates (as a percent of target) for the Annual Cash Incentive Award are calculated at actual foreign currency rates and currency neutral rates for the U.S. Dollar during the fiscal year. The difference between total payout rates under these two translation methods is all currency related, and the Committee has determined that the first 10% of this difference should not affect final payouts. The final payout includes a currency adjustment equal to the difference between these two payout rates less 10%, which represents a corridor or range of fluctuation in currency rates for which management is accountable. We believe this policy is appropriate because it requires management to respond to currency fluctuations within a specified range. However, it does not unfairly benefit or harm management if currency impact is beyond what may be considered normal and not under management’s control.
As an example of the policy in practice, if the difference between the two payout percentage rates is equal to or less than +/- 10 percentage points, the Annual Cash Incentive Award payout will be based on the calculation at actual currency rates, with no adjustment. When the payout percentage at actual currency rates is more than 10 percentage points lower than the payout percentage rate at currency neutral rates, the final payout will be based on the currency neutral calculation adjusted downward by 10 percentage points. Conversely, when the payout percentage rate at actual currency rates is more than 10 percentage points higher than the payout percentage rate at currency neutral rates, the final payout rate will be based on the currency neutral calculation adjusted upward by 10 percentage points.
Foreign Currency Translation Methodology
For purposes of applying the currency adjustment policy, current year financial statements and supplemental schedules are retranslated at prior year exchange rates using the same methodology as disclosed in Note 1 in the “Notes to Consolidated Financial Statements” section of our Form10-K for 2018 to determine the currency neutral result, with the exception that we do not attempt tore-measure gains and losses, based on a retranslation at prior year exchange rates, from foreign currency transactions, including forward contracts, of Nordson’s subsidiaries and the United States parent, in order to include the effect in net income. All currency rates are determined from published sources. Monthly average rates are the average of daily spot rates of currency exchange. The annual measurement period is the sum of each month translated at monthly average rates.
Nordson Corporation – 2019 Proxy Statement | | 43 |
2018 Actions and Analysis
During our November 20, 2017 meeting, and taking into consideration Exequity’s analysis of the peer group annual incentive opportunities, we set a target payout opportunity for our named executive officers as well as the threshold and maximum payout opportunity as a percentage of annualized base salaries. The following table reflects the payout opportunities as a percentage of base salary:
| Incentive Amount as a Percentage (%) of Base Salary | ||||||
Name
|
Threshold
|
Target
|
Maximum
| |||
Michael F. Hilton
|
50.0
|
100
|
200
| |||
Gregory A. Thaxton
|
35.0
|
70
|
140
| |||
John J. Keane
|
35.0
|
70
|
140
| |||
Gregory P. Merk
|
32.5
|
65
|
130
| |||
Jeffrey A. Pembroke
|
32.5
|
65
|
130
| |||
We then established quantitative corporate financial performance measures and goals, which measures account for 50% of the Annual Cash Incentive Award payout (if any):
Measure
|
Threshold
|
Target
|
Maximum
|
Weighting
| ||||
Diluted Earnings Per Share Growth
|
0%
|
8%
|
20%
|
50%
| ||||
Return on Total Capital
|
8.0%
|
11.5%
|
16%
|
50%
|
| * | Straight line interpolation applies to performance between designated goals. |
Operating unit performance measures and respective weighting were establishedset through a collaborative effort between the Committee and Mr. Hilton:
Measure
| Weighting (%)
| |||
Revenue Growth (year-over-year) | 20 | |||
Operating Profit Growth (year-over-year) | 40 | |||
Operating Margin (as % of revenue) | 20 | |||
Asset Turns (% achieved) | 10 | |||
Days of Inventory | 10 | |||
|
SpecificIndividual operating unit performance levelsgoals and actual operating results are not disclosed in this CD&A because we believe that the disclosure would result in competitive harm to us by potentially disrupting our customer, vendor and supplier relationships and providing our competitors with insight into our business strategies beyond what is disclosed publicly. We also do not believe that the disclosure of 2015 levelsindividual operating unit performance goals and results for 2018 is material to an understanding of our 20152018 executive compensation program as covered by this Proxy Statement.
The Committee met following the conclusion
| 44 | | Nordson Corporation – 2019 Proxy Statement |
Determining Payout Amounts
Determination of the 2015 fiscal year and first determined the Section 162(m)Annual Cash Incentive Award payout pool – $3,929,000 (1.5%is atwo-step process:
Step 1: Calculation of the Company’s cash flow from operating activities) –Payout Rate (as a % of Target) on an Actual Currency and then allocated the pool based on the allocation described above, thus establishing the Section 162(m) maximum payout opportunity for Mr. Hilton ($2,160,950) and Messrs. Keane, Merk and Bloomfield ($589,350 each).Currency Neutral Basis
The Compensation Committee then certified actual and currency adjusted performance for the Cash Incentive Award corporate financial and operating unit measures described above:
| Measures | Target (%) | Actual (% of Target) | Currency (% of Target) | |||
Diluted Earnings Per Share Growth | 10.0 | 0 | 85.5 | |||
Return on Total Capital | 11.50 | 140.0 | 186.7 | |||
Operating Unit | — | 10.5 - 110.3 | 10.7 - 173.9 |
Summary of Payouts
The Committee determined the combined currency adjusted corporate and operating unit performance, which are presented in the table below. The final adjusted payouts include the first 10% of the impact of currency pursuantPrior to applying the currency adjustment policy. Further adjustments topolicy described above, the formulaicCommittee first certified performance and calculated payouts underas a percentage of target for the Cash Incentive Award were madecorporate financial measures:
Actual Currency — Performance Unadjusted for Messrs. HiltonEffect of Currency Fluctuation, and Keane;
Currency Neutral — Performance Adjusted for Effect of Currency Fluctuation
The results are reflected in the former resulting from the Board of Directors’ assessment of less-than expected results on an enterprise-wide operating plan basis, and the latter resulting from his efforts in driving global business plan strategic initiatives.following table:
| Named Executive Officer | Target Payout Opportunity ($) | Combined Currency (% of Target) | Final Adjusted (% of Target) | Actual Payout ($) | ||||||||||||
Michael F. Hilton
|
| 825,000
|
|
| 121
|
|
| 97
|
|
| 800,000
|
| ||||
Gregory A. Thaxton
|
| 294,000
|
|
| 121
|
|
| 111
|
|
| 326,340
|
| ||||
John J. Keane
|
| 283,500
|
|
| 73.4
|
|
| 100
|
|
| 283,500
|
| ||||
Gregory P. Merk
|
| 207,000
|
|
| 150.7
|
|
| 140.7
|
|
| 291,249
|
| ||||
Douglas C. Bloomfield
|
| 176,000
|
|
| 155
|
|
| 145
|
|
| 255,200
|
| ||||
| Measures | Target Performance | Performance at Actual Currency | Payout at (% of Target) | Performance Neutral | Payout at Currency Neutral (% of Target) | |||||||
Diluted Earnings Per Share Growth
|
$5.49
|
$5.70*
|
134.4
|
$5.41*
|
|
90.2
|
| |||||
Return on Total Capital
|
11.5%
|
13.7%*
|
148.9
|
13.1%*
|
|
135.6
|
| |||||
Combined Corporate Factor
|
141.6
|
|
112.9
|
| ||||||||
All payouts were below
| * | As noted on Page 33, this data excludes the benefits from the Tax Cuts and Jobs Act. |
The Committee next certified the Section 162(m)operating units’ results, at actual currency and at currency neutral. The range of the Internal Revenue Code funding formula and the 2012 Stock Incentive and Award Plan $5,000,000 maximum payout for the Cash Incentive Award.results, as a percent of target, were:
Operating Unit Results
Currency Calculation Method | % of Target (Range) | |
Actual Currency | 50.7 – 185.5 | |
Currency Neutral | 41.5 – 158.1 |
Step 2: Calculation of Payouts to Named Executive Officers Applying the Currency Adjustment Policy
For named executive officers who have responsibility for certain corporate functions (including our Chief Executive Officer and Chief Financial Officer), the corporate financial measures account for 50% of any payout with a weighted average of the business unit quantitative operating measures accounting for the other 50% of the payout. For the operating unit named executive officers, the corporate financial measures account for 50% of any payout with the respective operating unit’s quantitative operating measures accounting for the other 50% of the payout.
Nordson Corporation – 2019 Proxy Statement | | 45 |
Following the process outlined in Step 1, the Committee determined the combined factor payouts, as a percent of target, and applied the currency adjustment policy. The results are presented in the tables below:
Actual Currency:
| Named Executive Officer | Target Payout | Corporate (% of Target)) | Operating Unit (% of Target) | Combined Factor Payout (% of Target) | ||||||
Michael F. Hilton
|
925,000
|
141.6
|
127.6 (Weighted)
|
|
134.6
|
| ||||
Gregory A. Thaxton
|
329,000
|
141.6
|
127.6 (Weighted)
|
|
134.6
|
| ||||
John J. Keane
|
318,500
|
141.6
|
95.1
|
|
118.4
|
| ||||
Gregory P. Merk
|
273,000
|
141.6
|
185.5
|
|
163.6
|
| ||||
Jeffrey A. Pembroke
|
269,750
|
141.6
|
157.3
|
|
149.5
|
| ||||
Currency Neutral:
| Named Executive Officer | Target Payout | Corporate (% of Target) | Operating Unit (% of Target) | Combined Factor Payout (% of Target) | ||||||
Michael F. Hilton
|
925,000
|
112.9
|
101.0 (Weighted)
|
|
107.0
|
| ||||
Gregory A. Thaxton
|
329,000
|
112.9
|
101.0 (Weighted)
|
|
107.0
|
| ||||
John J. Keane
|
318,500
|
112.9
|
80.0
|
|
96.5
|
| ||||
Gregory P. Merk
|
273,000
|
112.9
|
114.3
|
|
113.6
|
| ||||
Jeffrey A. Pembroke
|
269,750
|
112.9
|
156.0
|
|
134.5
|
| ||||
Under the currency adjustment policy, because the payout calculation at actual currency was higher than payout at currency neutral by more than ten percentage points, final payouts were adjusted upward by ten percentage points from the currency neutral calculation, reflecting the Committee’s position that payouts should be affected by only the first ten percentage points of the impact of currency fluctuation:
Named Executive Officer | Target Payout | Actual Payout ($) | ||||
Michael F. Hilton
|
925,000
|
|
1,082,250
|
| ||
Gregory A. Thaxton
|
329,000
|
|
384,930
|
| ||
John J. Keane
|
318,500
|
|
339,203
|
| ||
Gregory P. Merk
|
273,000
|
|
337,428
|
| ||
Jeffrey A. Pembroke
|
269,750
|
|
389,789
|
| ||
Except for excluding the financial benefits the Company received from the Tax Cuts and Jobs Act, no discretion was exercised to increase or decrease the formulaic incentive award payouts to the named executive officers.
| 46 | | Nordson Corporation – |
Long-Term Incentive Awards
Our long-term incentive awards are delivered through a combination of three equity vehicles:forms of equity: (i) incentive-based performance shares;share units; (ii) stock options; and (iii) service-based restricted shares. This combination of awards balances the opportunity between performance share units, which are earned based on multi-year financial performance, and stock options and restricted shares, the value of which is based on performance of our common shares.
To determineThe Committee begins the sizeprocess of determining equity awards by comparing our equity compensation programs to those of our peer group. The Committee also reviews market compensation data based on survey data provided by Aon Hewitt.
In reaching a final decision on the mix and mixamount of equity-basedequity compensation for the long-term incentive awards,our named executive officers should receive, the Committee takes numerous factors into consideration. As referenced above, market alignment and competitiveness are key factors the Committee considers in setting equity compensation levels. Other factors considered are current industry trends, practices among our peer group, and the behaviors the awards are intended to drive. In addition to these factors, the Committee places significant weight on the dilutive impact equity issuances have on our shareholders. In assessing dilution, the Committee considers the annualized effect of equity compensation by analyzing the equity “burn rate” overone- and three-year periods. Burn rate, in its simplest form, is determined by dividing the projected number of shares to be issued to employees by the weighted average number of shares outstanding. The Committee also considers the aggregate impact of all past equity compensation grants by looking at the company’s equity compensation “overhang.” Overhang is determined by dividing all outstanding equity grants and shares available for future grants by the total number of shares outstanding. The resulting percentage provides the Committee with insight into the long-term cost of the Company’s equity compensation programs.
Approximate allocation of the three equity components (as a percent of the long-term incentive compensation opportunity) is as follows:
| Equity | % | of Opportunity | ||
Performance
|
| 40 |
| |
Stock Options
|
| 40 |
| |
Restricted Shares
|
| 20 |
|
Performance SharesShare Incentive Award
A portion of each named executive officer’s total direct compensation opportunity is in the form of performance share units which convert toare settled in unrestricted Nordson Common Stock at time of payout.
Purpose
The purpose of the Performance Share Incentive Award is to drive high-performance results over a longer period (three years) based on the achievement ofpre-established quantitative performance goals which focus our executives on key business strategies and align the interests of our executive officers with our long-term shareholders. Executive officers are provided the opportunity to earn a significantly greaterhigher payout if target performance is exceeded but bear the risk of a lower payout if target performance is not achieved, and no payout if threshold performance is not achieved.
Nordson Corporation – 2019 Proxy Statement | | 47 |
Measures and Goals
In selecting the quantitative performance measures and levels,goals, the Committee considers whether the measures are appropriately aligned with those in the Annual Cash Incentive Award so that the overall compensation design does not unintentionally encourage our executive officers to take unnecessary or excessive risk or actions that are inconsistent with our year-over-year and long-term objectives. In addition,Performance and payouts under the Committee applies the currency adjustment policy described in the “Cash Incentive Award” section above to determine Performance Share Incentive Award payouts.
Awardare determined based on quantitative corporate financial measures — cumulative diluted earnings per share growth and cumulative revenue growth. We intend Performance Share Incentive Award payouts to be deductible for federal income tax purposes under Section 162(m) ofbelieve these measures offer the Internal Revenue Code. In order to achieve this, we establish Performance Share Incentive Award poolproper balance between growth and profitability over a maximum payout amount from the pool for each named executive officer subject to Section 162(m). The Committee has the authority to decrease payouts below the maximum payout amount (e.g., exercise “negative discretion”) but may not increase payouts above this maximum amount.longer term. More specifically:
2015 Actions and Analysis
The Committee established quantitative performance measures and levels for the 2013-2015 Performance Share Incentive Award in November 2012. These measures are equally-weighted.
Measure | Threshold | Target | Maximum | |||
Cumulative Diluted Earnings Per Share Growth | 4% | 8% | 14% | |||
Cumulative Revenue Growth | 5% | 7% | 11% |
Cumulative diluted earnings per share growth measures the rate at which management has succeeded in growing profits on a sustained basis over a three-year period. ItWe believe it is the constant percentage by which diluted earnings per share would need to grow over a base period amount during a three-year period such that the sum of diluted earnings per share calculated at such a constant growth rate for such three years is equal to the sum of the actual diluted earnings per share earned over the same three-year period. ItWe believe it is a superior measure of sustained earnings growth because it is influenced by the earnings performance during each year of the performance period rather than simply a compound growth rate that compares the final year’s earnings to the base period amount.
|
Cumulative revenue growth measures the rate at which management has succeeded in growing revenue on a sustained basis over a three-year period. We believe it is the constant percentage by which revenue would need to grow over a base period amount during a three-year period such that the sum of revenue growth calculated at such a constant growth rate for such three years is equal to the sum of the actual revenue growth over the same three-year period. We believe it is a superior measure of sustained revenue growth because it is influenced by revenue performance during each year of the performance period rather than simply a compound growth rate that compares the final year’s revenues to the base period amount. While the growth in profits and profitability are of primary importance, management is also expected to grow the size and scale of the Companyenterprise and cumulative revenue growth is an effective measure of their success in doing so.
ForAs noted above, the 2013-2015 performance period, eachCompensation Committee voted to exclude from the executive compensation analysis, including calculation of our executive officers was eligiblethe 2018 long term incentive awards, all financial benefits the Company received as a result of the Tax Cuts and Jobs Act passed in 2017.
Effect of Foreign Currency Fluctuation
The Committee has determined that the currency adjustment policy described in the “Annual Cash Incentive Award” section above should also apply to receive a maximum aggregate payout value in common shares equal to 1.75%the determination of our total operating cash flowPerformance Share Incentive Award payouts.
Foreign Currency Translation Methodology
In certifying the results for the three-yearfinancial performance period, by reference to our 2013, 2014, and 2015 Form 10-K Reports, subject to the 750,000 share limit (250,000 per year for each year of the performance period) provided for by our shareholder-approved 2012 Stock Incentive and Award Plan.
After the close of 2015, we confirmed that the maximum aggregate payout to any executive officer could not exceed 201,058 shares; the share equivalent value of $14,323,000 (1.75% of our operating cash flow over a three year period). We then determined the maximum payout for Section 162(m) participants ofmeasures employed in calculating the Performance Share Incentive Award, pool: Mr. Hilton – 110,582 shares (55%)the Committee applies the same methodology described in the “Annual Cash Incentive Award” section above, with the revenue and Messrs. Keane, Merk and Bloomfield – 30,159 shares (15% each).
The Compensation Committee then certifiedearnings per share at currency neutral rates reflecting the cumulative effect of differences from actual and currency adjustedexchange rates over the three-year versusone-year performance for the2013-2015 Performance Share Award for the measures described above:
| Measure | Target (%) | Actual (% of Target) |
Currency (% of Target) | |||||||||
Cumulative Diluted Earnings Per Share Growth | 8 | 0 | 81.1 | |||||||||
Cumulative Revenue Growth | 7 | 122.8 | 169.3 | |||||||||
Summary of Payouts
The Committee determined the combined currency adjusted performance, leading to the following payouts to the named executive officers for 2015:
| Named Executive Officer | Target (# share units) | Combined (% of Target) | Final (% of Target) | Payout (# shares) | Payout ($)* | |||||||||||||||
Michael F. Hilton
|
| 16,000
|
|
| 125.2
|
|
| 115.2
|
|
| 18,432
|
|
| 1,167,667
|
| |||||
Gregory A. Thaxton
|
| 4,100
|
|
| 125.2
|
|
| 115.2
|
|
| 4,723
|
|
| 299,202
|
| |||||
John J. Keane
|
| 4,400
|
|
| 125.2
|
|
| 115.2
|
|
| 5,069
|
|
| 321,121
|
| |||||
Gregory P. Merk
|
| 2,800
|
|
| 125.2
|
|
| 115.2
|
|
| 3,226
|
|
| 204,367
|
| |||||
Douglas C. Bloomfield
|
| 2,800
|
|
| 125.2
|
|
| 115.2
|
|
| 3,226
|
|
| 204,367
|
| |||||
| Nordson Corporation – |
In-Progress2018 Actions and Analysis
During its November 23, 2015 meeting, the Committee established quantitative performance measures and goals for the 2016-2018 Performance Share Incentive Awards:Award. These measures are equally-weighted.
| Measure | Threshold | Target | Maximum | |||
Cumulative Diluted Earnings Per Share Growth
| 4%
| 8%
| 14%
| |||
Cumulative Revenue Growth | 5% | 7% | 11% |
Determination of Payout Amounts
Determination of the Performance Share Incentive Award payouts is atwo-step process:
Step 1: Calculation of the Payout Rate (as a % of Target) on an Actual Currency and Currency Neutral Basis
Prior to applying the Currency Adjustment Policy described above, the Committee first certified performance for the Cumulative Earnings per Share Growth and Cumulative Revenue measures:
Actual Currency – performance unadjusted for the effect of currency fluctuation, and
Currency Neutral – performance adjusted for the effect of currency fluctuation.
Following this certification process, the Committee calculated the payouts as a percent of target. The results are reflected in the following table:
Measures
| Target Performance
| Performance
|
Payout at (% of Target)
| Performance
|
Payout at (% of Target)
| |||||
Cumulative Diluted Earnings
|
$12.10
|
$15.51^
|
100%
|
$15.85^
| 100%
| |||||
Cumulative Revenue
|
$5,809*
|
$6,130.7*
|
85.3%
|
$6,174.9*
|
90.2%
| |||||
Combined Factor
|
185.3%
| 190.2% |
| ^ | As noted on Page 33, this data excludes the benefits from the Tax Cuts and Jobs Act. |
| * | millions |
Step 2: Calculation of Payouts to Named Executive Officers Applying the Currency Adjustment Policy
Under the currency adjustment policy, because the difference between the two payout percentage rates is equal to or less than +/- 10 percentage points, the final payouts for the 2016-2018 performance period are based on the calculation at actual currency rates, with no adjustments:
| Named Executive Officer | Target Payout Opportunity (# of Shares) |
Post-Currency (% of Target) | Payout (# of Shares) | |||||||||
Michael F. Hilton
|
|
18,400
|
|
|
185.3
|
|
|
34,095
|
| |||
Gregory A. Thaxton
|
|
4,800
|
|
|
185.3
|
|
|
8,894
|
| |||
John J. Keane
|
|
4,800
|
|
|
185.3
|
|
|
8,894
|
| |||
Gregory P. Merk
|
|
3,400
|
|
|
185.3
|
|
|
6,300
|
| |||
Jeffrey A. Pembroke
|
|
1,800
|
|
|
185.3
|
|
|
3,335
|
| |||
Nordson Corporation – 2019 Proxy Statement | | 49 |
Except for excluding the financial benefits the Company received from the Tax Cuts and Jobs Act, no discretion was exercised by the Compensation Committee to increase or decrease the formulaic incentive award payouts to the named executive officers.
In-Progress Performance Share Incentive Awards
The following tables summarize the key elements and total share payout amounts for the named executive officers on a cumulative basis at threshold, target, and maximum performance for the 2014-20162017-2019 and 2015-20172018-2020 Performance Share Incentive Awards.
2014-20162017-2019 Performance Share Incentive Award
| Performance Measure | Threshold | Target | Maximum | Threshold
| Target
| Maximum
| ||||||||||||||||||
Cumulative Diluted EPS Growth | 4 | % | 8 | % | 14 | % | ||||||||||||||||||
Cumulative Diluted Earnings Per Share Growth
|
|
4%
|
|
|
8%
|
|
|
14%
|
| |||||||||||||||
Cumulative Revenue Growth | 5 | % | 7 | % | 11 | % |
|
5%
|
|
|
7%
|
|
|
11%
|
| |||||||||
| Award Date | Award Date Share Price | Threshold (# Shares) | Target (# Shares) | Maximum (# Shares) | Target Earned Date | Actual Payout | ||||||||||||||||||
11/24/2013 | $ | 69.25 | 13,650 | 27,300 | 54,600 | October 31, 2016 | Not determined | |||||||||||||||||
| Grant Date |
Grant Date Share | Threshold (# Shares) | Target (# Shares) | Maximum (# Shares) | Target Earned Date | Actual Payout | ||||||
11/21/2016
|
$107.65
|
13,240
|
26,480
|
52,960
|
October 31, 2019
|
Not determined
|
2015-20172018-2020 Performance Share Incentive Award
| Performance Measure | Threshold | Target | Maximum |
Threshold |
Target |
Maximum | ||||||||||||
Cumulative Diluted EPS Growth | 4 | % | 8 | % | 14 | % | ||||||||||||
Cumulative Diluted Earnings Per Share Growth
|
2%
|
8%
|
14%
| |||||||||||||||
Cumulative Revenue Growth | 5 | % | 7 | % | 11 | % |
2%
|
5%
|
8%
| |||||||||
| Award Date | Award Date Share Price | Threshold (# Shares) | Target (# Shares) | Maximum (# Shares) | Target Earned Date | Actual Payout | ||||||||||||||||||
11/23/2014 | $ | 76.48 | 14,050 | 28,100 | 56,200 | October 31, 2017 | Not determined | |||||||||||||||||
| Grant Date |
Grant Date Share | Threshold (# Shares) | Target (# Shares) | Maximum (# Shares) | Target Earned Date | Actual Payout | ||||||||||
11/20/2017
|
$127.67
|
11,950
|
23,900
|
47,800
|
|
October 31, 2020
|
|
|
Not determined
|
| ||||||
Stock Options
Stock options align the interests of the named executive officers with those of shareholders because the stock options only have value if the price of the Company’s stock increases after the stock options are awarded. Stock options vest in 25% increments over a four-year period (beginning one year from(on the datefirst four anniversaries of award)the grant date) and generally expire ten years from the date of award.grant date. We fix the exercise price of an option at the fair market value on the awardgrant date. Thus, an option becomes more valuable as the price of our common shares increases. Stock options are also a valuable retention tool because our option awards vest over a four-year period and unvested options are forfeited if an executive officer voluntarily terminates his or her employment.
We awardedgranted stock options to our executive officers during ouron November 24, 2014 meeting,20, 2017, at the same time we awardedgranted stock options to other key employees under our Key Employee Stock Option Program. We have historically awardedgranted stock options during thisthe Compensation Committee’s November meeting, which is scheduled annually at this time of year, to permit us to verify prior fiscal year performance results, to determine incentive award payouts, and to set compensation and performance measures and levelsgoals for the next fiscal year.
| 50 | | Nordson Corporation – 2019 Proxy Statement |
The following table provides the number of stock options awardedgranted to our named executive officers for 2015:2018:
| Named Executive Officer | Options Awarded (#) | Award Date Fair Value ($)(1) | Options Granted (#) |
Grant Date | ||||||||||||
Michael F. Hilton | 49,100 | 1,425,589 |
|
55,800
|
|
|
1,942,599
|
| ||||||||
Gregory A. Thaxton | 12,200 | 354,220 |
|
12,500
|
|
|
435,170
|
| ||||||||
John J. Keane | 12,500 | 362,930 |
|
12,500
|
|
|
435,170
|
| ||||||||
Gregory P. Merk | 8,300 | 240,986 |
|
9,000
|
|
|
313,322
|
| ||||||||
Douglas C. Bloomfield | 7,900 | 229,372 | ||||||||||||||
Jeffrey A. Pembroke
|
|
8,400
|
|
|
292,434
|
| ||||||||||
| (1) | The |
|
Restricted Shares
Restricted shares are designed to align executive officers’ interest with that of our long-term shareholders. The Committee also views this programthese service-based awards as an important management succession planning, retention, and recognition tool, and directly tiestying our executive officers’ compensation to the goal of increasing the value of our shareholders’ investment. Restricted shares generally will vest over a three-year period and cannot be transferred until such vesting. Restricted shares provide participants with dividends and voting rights beginning on the awardgrant date.
We awardedgranted restricted shares to executive officers during ouron November 24, 2014 meeting.20, 2017. The share price on the awardgrant date was the closing price on November 24, 201420, 2017 – $79.66.$127.67. The following table provides information regarding the 2018 restricted share award:awards:
| Named Executive Officer | Restricted Shares Awarded (#) | Award Date Value ($) |
Restricted | Grant Date Value ($) | ||||||||||||
Michael F. Hilton | 7,500 | 597,450 |
|
6,700
|
|
|
855,389
|
| ||||||||
Gregory A. Thaxton | 1,800 | 143,388 |
|
1,600
|
|
|
204,272
|
| ||||||||
John J. Keane | 1,800 | 143,388 |
|
1,600
|
|
|
204,272
|
| ||||||||
Gregory P. Merk | 1,400 | 111,524 |
|
1,200
|
|
|
153,204
|
| ||||||||
Douglas C. Bloomfield | 1,200 | 95,592 | ||||||||||||||
Jeffrey A. Pembroke
|
|
1,000
|
|
|
127,670
|
| ||||||||||
Nordson Corporation – 2019 Proxy Statement | | 51 |
PART IV: OTHER COMPONENTS OF OUR EXECUTIVE COMPENSATION PROGRAM
In addition to base salary, the Annual Cash Incentive Award, and long-term equity-based incentive awards, we offer other forms of compensation, including: (i) executive perquisites; (ii) welfare and retirement benefits; and(iii) change-in-control benefits.
Executive Perquisites
We provide limited and modest perquisites to each of our executive officers to promote the business objectives facilitated by each perquisite described below. We also use these perquisites to provide a competitive executive compensation program, thatwhich allows us to attract and retain top executive talent.
| • | Business Clubs. We do not reimburse any executive officer for fees or dues associated with personal country club memberships. We reimburse Mr. Hilton for |
| • | Financial, Estate, and Tax Planning and Preparation. We pay for financial, estate, and tax planning and preparation fees and expenses. The maximum amount is $5,000 for each named executive officer per calendar year. We provide this perquisite to assist our executive officers in obtaining financial counseling, enabling them to concentrate on business matters rather than on personal financial planning. |
| • | Executive Physicals. We pay for annual physicals for our executive officers. We provide this benefit to preserve our investment in our executive officers by encouraging them to maintain healthy lifestyles and be proactive in their preventative healthcare. |
| • | Relocation Expense Reimbursement. We maintain a general relocation policy under which the Company provides reimbursement for certain relocation expenses to new employees and to employees whose job function requires |
| Nordson Corporation – |
Welfare and Retirement Benefits
The following summarizes the welfare and retirement benefits available to our named executive officers:
Qualified Defined Contribution |
• Our executive officers are eligible to participate in a Company-sponsored 401(k)tax-qualified retirement savings plan for all U.S.-based employees.
• We match employee contributions $0.50 on the dollar for the first 6% of contributed compensation. Employee contributions to the 401(k) Plan vest immediately, while matching contributions vest in increments based on years of service, with participants being fully vested after three years of service.
|
Non-Qualified Deferred Compensation Plan |
• We maintain anon-qualified, unfunded, and unsecured deferred compensation plan for the benefit of eligible management employees whose benefits under the 401(k) Plan are limited by the benefit restrictions of Section 415 of the Internal Revenue Code.
• Participants are able to defer up to 100% of their base salary and Annual Cash Incentive Award payout, and up to 90% of their Performance Share Incentive Award payout.
|
Defined Benefit Pension Plan |
• Our executive officers participate in a Company-sponsoredtax-qualified pension plan for U.S.-based salaried employees. The pension plan is designed to work together with social security benefits to provide employees with 30 years of service retirement income that is approximately 55% of eligible compensation, subject to the Internal Revenue
|
Excess Defined Benefit Pension Plan |
• We maintain a supplemental executive retirement benefit restoration plan which is an unfunded,non-qualified plan that is designed to provide retirement benefits to U.S.-based eligible participants as a replacement for those retirement benefits limited by regulations under the Internal Revenue Code.
• Together, the defined benefit pension plan and excess defined benefit pension plan are intended to provide executive officers with retirement income at a level equivalent to that provided to other employees under the defined benefit pension plan.
|
Severance Agreements
Mr. Hilton is the only executive for which the Company haswe have any obligation to pay severance other than following achange-in-control. As part of the negotiated employment agreement with Mr. Hilton and consistent with an agreement we had with his predecessor, we agreed to provide Mr. Hilton with a cash severance and other benefits in the event his employment is terminated by us without “Cause” or Mr. Hilton terminates his employment with us for “Good Reason” (each such term as defined in Mr. Hilton’s employment agreement).
|
Upon a termination by us without Cause or by Mr. Hilton for Good Reason, in addition to payment of any accrued and unpaid compensation and benefits, Mr. Hilton is entitled to post-termination payments and benefits as follows:
an amount equal to two (2) times the sum of his annual base salary and the greater of (x) ninety percent (90%) of his annual base salary or (y) his target cash incentive opportunity;
Nordson Corporation – 2019 Proxy Statement | | 53 |
apro-rata payout of his Annual Cash Incentive Award, based on actual performance;
apro-rata payout of long-term performance share awards awardedgranted to Mr. Hilton for any performance period(s) not completed on the date of termination, based upon actual performance in each such applicable performance period, as determined at the end of the applicable performance period;
full vesting of restricted share awards; and
continuation of health care and welfare benefits for a period of twenty-four (24) months following the date of termination.
We will notgross-up any tax imposed upon any payment received by Mr. Hilton under his employment agreement.
Change-in-Control
We believe that the occurrence, or potential occurrence, of achange-in-control transaction in which we are the target could create substantial uncertainty regarding the continued employment of our executive officers. Therefore, we have entered intochange-in-control retention agreements with our executive officers that provide severance and other benefits in the event of a qualifying termination following achange-in-control. The primary purpose of these agreements is to keep senior executives focused on pursuing all corporate transaction activity that is in the best interests of shareholders, regardless of whether those transactions may result in their own job loss. Reasonable post-acquisitionThe Committee has determined thatchange-in-control retention agreements executed after November 1, 2015 will not provide for“gross-up” payments to cover any federal excise taxes that may be owed onchange-in-control severance payments and benefits.Change-in-control retention agreements executed prior to November 1, 2015, which do provide for agross-up for any excess federal excise taxes that may be owed on change in control-related severance payments and benefits, should serve the interests of both the executive and our investors.remain in effect.
Severance and Other Benefits
Severance benefits payable underchange-in-control retention agreements are conditioned upon the occurrence of a “double trigger” event (meaning there must be both achange-in-control of the Company and, within the following 24 months, a termination of employment by either the Company without Cause, or by the officer for Good Reason, as defined in the respectivechange-in-control retention agreements). We opted for a double-trigger, rather than a “single trigger” that provides for severance payments solely on the basis of achange-in-control, since a double trigger is consistent with the purpose of encouraging the continued employment of the executive following achange-in-control.
In the event of achange-in-control and a qualifying termination of employment, an executive officer will be entitled to receive:
accrued but unpaid compensation, including apro-rata payout of the Annual Cash Incentive Award;
a lump sum payment in an amount equal to two (2) times the sum of (x) annual base salary in effect at the time of termination of employment plus (y) target Annual Cash Incentive Award opportunity for the year in which termination of employment occurs;
continuation of coverage for the executive officer and his or her eligible spouse and dependents under the Company’s group health plans for 24 months following termination of employment or until the date he or she becomes covered under similar benefit plans;
professional outplacement services; and
two additional years of age and two additional years of service credit under the Company-sponsored qualified andnon-qualified pension plans, the benefit being paid from the Excess Defined Benefit Pension Plan.
| Nordson Corporation – |
Severance benefits made to an executive officer due to a termination following a change-in-control may be subject to federal excise tax. We no longer, on a prospective basis, gross up any severance benefits for tax purposes. For legacy change-in-control retention agreements, we provide the executive officer with a tax gross-up payment to offset the effect of the excise tax. For more details regarding the terms and conditions of these change-in-control retention agreements, see “Potential Benefits Upon Termination” later in this Proxy Statement.
Treatment of Share-based Awards
To provide our named executive officers with the same opportunity as our shareholders to realize the value created by achange-in-control, the shareholder-approved Amended and Restated 2012 Nordson Corporation Share and Incentive Award Plan provideshistorically has provided for full vesting of all outstanding share-based Awards upon achange-in-control.
PART V: COMPENSATION COMMITTEE ACTIONS RELATED TO 2016
EXECUTIVE COMPENSATION
We engaged Exequity to assist us However, effective for awards granted under that plan after December 27, 2017, equity awards generally will vest on a “double-trigger” basis, in establishing 2016 compensation for our executive officers. During our November 23, 2015 meeting,the event of achange-in-control and after considering the recommendations of Exequity and Mr. Hilton, we set the following 2016 base salaries, incentive compensation opportunities, and financial performance measures.
Base Salary
The base salary increases for the named executive officers range from 3.03% to 10.14%. Mr. Hilton’s base salary increase was 3.03%.
Cash Incentive Award
Performance measures for the quantitative corporate financial elementa qualifying termination of the Cash Incentive Award are:
Measure | Threshold | Target | Maximum | |||
Diluted Earnings per Share Growth | 0% | 10% | 20% | |||
Return on Total Capital | 8% | 11.5% | 16% |
Performance Share Incentive Award
For the 2016-2018 Performance Share Incentive Award, we established the following threshold, target, and maximum cumulative diluted earnings per share growth and cumulative revenue growth performance measures:
Measure | Threshold | Target | Maximum | |||
Cumulative Diluted Earnings per Share Growth | 4% | 8% | 14% | |||
Cumulative Revenue Growth | 5% | 7% | 11% |
We awarded stock options, performance share units for the 2016-2018 Performance Share Incentive Award, and restricted shares to our executive officers consistent with our equity award policy in the following amounts:
| Named Executive Officer | Options (# Shares) |
Performance | Restricted Shares (#) | |||||||||
Michael F. Hilton | 72,800 | 18,400 | 9,200 | |||||||||
Gregory A. Thaxton | 17,200 | 4,800 | 2,400 | |||||||||
John J. Keane | 17,200 | 4,800 | 2,400 | |||||||||
Gregory P. Merk | 13,400 | 3,400 | 1,700 | |||||||||
Douglas C. Bloomfield | 11,700 | 3,000 | 1,500 | |||||||||
Nordson Corporation – | | |
PART VI:V: POLICIES RELATED TO EXECUTIVE COMPENSATION
Equity Award Policy
We awardgrant equity on a consistent schedule, generally at the first Committee meeting following the closeend of the fiscal year. We do not award performance-sharegrant performance share units, stock options, or restricted shares to our executive officers in anticipation of the release of significant earnings announcements or other materialnon-public information likely to result in changes to the price of our common shares. Similarly, we do not time the release of materialnon-public information based on equity award grant dates. Awards generally are effective on the date that we grant the award. The Committee may also make occasional awardsgrants of stock options and other equity-based awards at other times to recognize, retain or recruit executive officers and key employees. We have delegated limited authority to Mr. Hilton to approvegrant equity awards, excluding awards made to executive officers. Equity awards approvedgranted by Mr. Hilton in any quarter will be effective the first day of the month following public disclosure of quarterly earnings for that quarter.
Incentive Compensation Forfeiture (Clawback) Policy
We have a formal “clawback” policy for incentive awards that is broader in its reach than that imposed by Section 304 of the Sarbanes-Oxley Act. Under the policy, we may require our executive officers to repay cash-based incentive compensation and/or forfeit equity incentive awards in the event of a material restatement of the consolidated financial statements of the Company, other than any restatement required pursuant to a change in applicable accounting rules. Recovery is limited to amounts paid or realized by an executive officer during the three-year period preceding the date that we are required to prepare a restatement.
Additionally, our Board of Directors, upon the Committee’s recommendation, may, to the extent permitted by law and to the extent it determines that it is in our best interests to do so, require reimbursement or payment by the executive officer to the Company of equity-based compensation and performance-based compensation in an amount determined by the Board of Directors to be attributable to: (i) conduct that violates our Code of Ethics and Business Conduct;Conduct, or (ii) willful misconduct or fraud that causes harm to the Company.
The Committee will revise the policy as appropriate once final rules are issued under the Dodd-Frank Wall Street Reform and Consumer Protection Act.
Share Ownership Guidelines
We require share ownership by our executive officers to emphasize our executive compensation program’s objective of aligning the individual financial interests of our executive officers with the investment interests of our long-term shareholders. We require our executive officers to own the following multiples of base salary in the equivalent number of common shares:
Chief Executive Officer | 5 times base salary | |
President (other than the Chief Executive Officer) | 3 times base salary | |
Chief Financial Officer | 3 times base salary | |
Other Executive Officers | 2 times base salary |
The number of shares required to be held varies according to our common share price movement. Newly elected or promoted executive officers will have up to five years to meet the ownership requirements after their election or promotion.election.
Executive officers who have not satisfied the share ownership requirements by the end of the five-year period or who have not shown progress (as subjectively determined by the Committee) toward the required ownership level prior to the end of such five-year period will be expected to retain 100% of the shares acquired through exercise of options, lapse of transfer restrictions on restricted shares or
| Nordson Corporation – |
Performance Share Incentive Award payouts, net of shares withheld to cover the taxes due, until the share ownership requirement is achieved or there is progress towards the ownership requirement. We review the share ownership of each executive officer compared to the applicable share ownership guidelines, including the number of vested stock options, share equivalent units in deferred compensation plans and share ownership in the Nordson Corporation Employee Stock Ownership Plan and 401(k) Plan, each of which count as valid forms of share ownership under the ownership guidelines. As of October 31, 2015,2018, all named executive officers, exceedexcept Jeffrey Pembroke, met or exceeded their respective ownership guidelines. Mr. Pembroke was named an executive officer in November 2015 and is required to meet the share ownership requirement by November 2020.
Anti-Pledging/Anti-Hedging Policy
We prohibit directors and executive officers from pledging Nordson common shares as collateral. Also prohibited isare trading in derivative securities of Nordson’s common shares, engaging in short sales of Nordson securities, or purchasing any other financial instruments (including prepaid variable forward contracts, equity swaps, collars, and exchange funds) that are designed to hedge or offset any decrease in the market value of Nordson securities.
DeductibilityTax and Accounting Treatment of Executive Compensation
The Committee takes into account the tax and accounting treatment of executive compensation arrangements when structuring our executive compensation program. One of those considerations is Section 162(m) of the Internal Revenue Code, which sets a limit of $1,000,000$1 million on the amount we can deduct for compensation paid to eachour “covered employees”. Historically, compensation meeting the requirements of the chief executive officer and the three other most highly compensated executive officers other than the chief financial officer. Compensation that qualifies as “performance-based” compensation“qualified performance-based compensation” under Section 162(m) doesdid not count toward the $1,000,000$1 million limit. PaymentsHowever, the Tax Cuts and Jobs Act, which was enacted on December 22, 2017, made a number of base salarychanges to Section 162(m), generally effective for taxable (fiscal) years beginning after December 31, 2017, including the repeal of the “qualified performance-based compensation” exemption and restricted shares (as currently structured) would not be excludablethe expansion of the definition of “covered employees” (for example, by including both the chief financial officer and thus, the payment of those amounts in excess of $1,000,000 in one fiscal year would, generally, be non-deductible.certain former named executive officers as covered employees).
Our general philosophy ishas been to attempt to qualify compensation for tax deductibility under Section 162(m) of the Internal Revenue Code, wherever we deem appropriate, recognizing that, under certain circumstances, the limitations may be exceeded. Qualification isHistorically, treatment as “qualified performance-based compensation” has been sought to the extent practicable and only to the extent that it is consistent with our overall compensation objectives. TheHowever, due to uncertainties regarding the scope of relief under the Tax Cuts and Jobs Act, there can be no guarantee that any compensation paid to our covered employees in excess of $1 million will be or remain exempt from Section 162(m).
In any event, the Committee however retains full discretion to construct compensation packages that will best attract, retain, and reward successful executive officers. Therefore, the Committee may award compensation that is not fully deductible under Section 162(m) if the Committee believes it will contribute to the achievement of our business objectives.
For 2015, payouts under Moreover, given the Cash Incentive Award and 2013-2015 Performance Share Incentive Award to executive officers subjectnature of the changes to Section 162(m) were made in accordance with performance-based compensation arrangementsunder the recent Tax Cuts and Jobs Act, the Compensation Committee expects that, were intended to qualify as tax deductible. In order to achieve this potential result, the Committee approved a framework in which (1) maximum payouts for these incentive awards were established in alignment with the provisions of the shareholder-approved equity award plans, (2) the Committee approved a pre-established compensation formula and sub-plan performance measures soon after the start of theNordson’s 2018 fiscal year, (3) performance results were certified after the endtax-deductible portion of the fiscal year, and (4) the Committee exercised negative discretion where it deemed appropriate to do so.
Nordson Corporation – | | |
We have reviewed and discussed with management the Compensation Discussion and Analysis that appears in this Proxy Statement. Based on such review and discussion, we recommended to the Board of Directors that the Compensation Discussion and Analysis be included in the Company’s definitive Proxy Statement on Schedule 14A and incorporated by reference into the Company’s 20152018 Annual Report, each as filed with the SEC.
Compensation Committee,
Mary G. Puma, ChairpersonChair
Lee C. Banks
Joseph P. KeithleyMichael J. Merriman, Jr.
Victor L. Richey, Jr.
January 29, 201618, 2019
The above Compensation Committee Report does not constitute soliciting material and should not be deemed filed with the SEC or subject to Regulation 14A or 14C (other than as provided in Item 407 of RegulationS-K) or to the liabilities of Section 18 of the Exchange Act, except to the extent that the Company specifically requests that the information in this Report be treated as soliciting material or specifically incorporates it by reference into a document filed under the Securities Act of 1933 (the “Securities Act”) or the Exchange Act. If this Report is incorporated by reference into the Company’s Annual Report on Form10-K, such disclosure will be furnished in such Annual Report on Form10-K and will not be deemed incorporated by reference into any filing under the Securities Act or the Exchange Act as a result of furnishing the disclosure in this manner.
| Nordson Corporation – |
RISKS RELATED TO EXECUTIVE COMPENSATION POLICIES AND PRACTICES
The Committee believes that the design of the executive compensation program as outlined in the “Compensation Discussion and Analysis” above places emphasis on long-term incentives and competitive base salaries. While the Annual Cash Incentive Award is tied to short-term performance, the Committee concluded that emphasis on long-term incentives appropriately balances risk and management’s motivations for our long-term success, including share price performance, with the interests of our long-term shareholders. Although our executive compensation program is designed topay-for-performance and provide incentive-based compensation, the incentive-driven elements of our executive compensation program contain various mitigating features that are designed to discourage management from taking unnecessary risks in managing the business that could maximize short-term results at the expense of long-term value.
The Committee has the authority to set performance measures and levels,goals, monitor performance, and to exercise negative discretion in determining incentive award payouts to our executive officers.
We believe that our compensation policies and practices do not encourage our executive officers to take excessive or unnecessary risks and are not reasonably likely to have a material adverse effect on the Company.
The table below summarizes the risk mitigation factors applicable to the primary elements of the Company’s executive compensation program.
Base Salary Risk Mitigation Factors |
Fixed Amount. Base salary does not encourage risk-taking as it is a fixed amount.
Small Percentage of Total Compensation. Base salary is a relatively small percentage of total direct compensation for executive officers. |
Annual Cash Incentive Award Risk Mitigation Factors |
Multiple Performance Factors. The Annual Cash Incentive Award features multiple quantitative performance measures that encourage executives to focus on the overall strength of the business rather than a single financial measure.
Award Cap. Awards payable to any individual are capped.
Management Processes. Board and management processes are in place to oversee risks associated with the Annual Cash Incentive Award, including, but not limited to, monthly and quarterly business performance reviews by management and regular business performance reviews by the Board of Directors and the Audit Committee.
Clawback Provision. Robust forfeiture (“clawback”) terms accompany cash-based incentive awards for our executive officers. |
Long-Term Equity Compensation Risk Mitigation Factors
|
Share Ownership Guidelines. Share ownership guidelines align the executive interests with those of our long-term shareholders.
Vesting Schedule Overlaps. The vesting schedules for long-term incentives overlap and, therefore, reduce an executive officer’s motivation to maximize performance in any one period.
Service-based Vesting. Service-based vesting
Anti-Hedging/Anti-Pledging Policy. The Company’s anti-hedging policy prohibits directors and our executive officers from purchasing any financial instrument that is designed to hedge or offset any decrease in the market value of our common stock, including prepaid variable forward contracts, equity swaps, collars, and exchange funds. Our anti-pledging policy prohibits our directors and executive officers from pledging our common stock as collateral.
Clawback Provision. Robust forfeiture (“clawback”) terms accompany equity-based |
Nordson Corporation – | | |
SUMMARY COMPENSATION FOR FISCAL YEAR 20152018
All references in this section to years are references to fiscal years unless otherwise noted. Our fiscal year ends October 31.
The following narratives, tables, footnotes, and supplemental tables present the components of compensation for our named executive officers for the fiscal year ended October 31, 2015.2018. The individual components of the compensation reflected in the Summary Compensation Table (“SCT”) for 20152018 and the prior two fiscal years are:
Salary. Base salary earned by a named executive officer. Any amount of base salary deferred by a named executive officer is identified in footnote 1 to the “Non-Qualifed“Non-Qualified Deferred Compensation” table.
Bonus. We did not award any discretionary cash bonus to ourany named executive officers.officer.
| • | Stock Awards. The awards disclosed in the “Stock Awards” column consist of restricted share awards and performance share awards for the |
Option Awards. The awards disclosed in the “Option Awards” column consist of option awards for our common stock. The award amounts represent the awardgrant date fair value of stock options as calculated under FASB ASC Topic 718. Details about the option awards made during 20152018 are included in the narrative accompanying the “Grants of Plan-Based Awards” table.
Non-Equity Incentive Plan Compensation. The amounts disclosed under the “Non-Equity“Non-Equity Incentive Plan Compensation” column represent compensation earned under the Annual Cash Incentive Award. Further information concerning the Annual Cash Incentive Award may be reviewed in Part III of the Compensation Discussion and Analysis section of this Proxy Statement under the caption “Key Components of Our Executive Compensation Program.”
Change in Pension Value.Value andNon-Qualified Deferred Compensation Earnings. The amounts disclosed in the “Change in Pension Value andNon-Qualified Deferred Compensation Earnings” column represent any actuarial increase during the fiscal year in the pension value provided under our qualified defined benefit pension plan andnon-qualified excess defined benefit pension plan. We do not pay above-market or preferential rates on thenon-qualified deferred compensation of our named executive officers. A narrative discussion of our defined benefit pension plan and excess defined benefit pension plan accompanies the “Pension Benefits” table.
All Other Compensation. The amounts disclosed in the “All Other Compensation” column include the combined value of theeach named executive officer’s perquisites, our matching contributions to the qualified deferred compensation 401(k) plan andnon-qualified deferred compensation plan and other noted payments.
| Nordson Corporation – |
Summary Compensation Table
In this section we provide certain tabular and narrative information regarding the compensation of our principal executive and financial officers and our three other most highly compensated executive officers for 2015.2018.
Name and Principal Position | Fiscal Year | Salary (1) $ | Bonus $ | Stock Awards (2) $ | Option Awards (3) $ | Non-Equity Incentive Plan Compensation (4) $ | Change in Pension Value & Non- Qualified Deferred Compensation Earnings (5) $ | All Other Compensation (6) $ | Total $ | Fiscal
| Salary (1) $
| Bonus
| Stock (2) $
| Option
| Non-Equity
| Change in & Non-
| All Other
| Total $
| ||||||||||||||||||||||||||||||||||||||||||||||||||||||
Michael F. Hilton | 2015 | 825,000 | — | 1,752,298 | 1,425,589 | 800,000 | 761,474 | 75,158 | 5,639,519 | 2018 | 925,000 | — | 2,509,619 | 1,942,599 | 1,082,250 | 454,746 | 82,876 | 6,997,090 | ||||||||||||||||||||||||||||||||||||||||||||||||||||||
President and Chief | 2014 | 800,000 | 1,534,825 | 1,233,462 | 1,294,000 | 535,762 | 96,057 | 5,494,106 | 2017 | �� | 875,000 | — | 2,347,868 | 1,829,045 | 1,103,375 | 505,485 | 87,542 | 6,748,315 | ||||||||||||||||||||||||||||||||||||||||||||||||||||||
Executive Officer | 2013 | 775,000 | 1,446,160 | 1,051,974 | 775,000 | 282,419 | 98,897 | 4,429,450 |
| 2016
|
|
| 850,000
|
|
| —
|
|
| 1,897,868
|
|
| 1,416,040
|
|
| 1,380,400
|
|
| 775,637
|
|
| 108,904
|
|
| 6,428,849
|
| |||||||||||||||||||||||||||||||||||||
Gregory A. Thaxton | 2015 | 420,000 | — | 434,012 | 354,220 | 326,340 | 514,429 | 34,511 | 2,083,512 | 2018 | 470,000 | — | 586,967 | 435,170 | 384,930 | 47,260 | 37,854 | 1,962,181 | ||||||||||||||||||||||||||||||||||||||||||||||||||||||
Senior Vice President, | 2014 | 390,000 | 385,375 | 317,754 | 410,036 | 702,369 | 43,509 | 2,249,043 | ||||||||||||||||||||||||||||||||||||||||||||||||||||||||||||||||
Executive Vice President, | 2017 | 450,000 | — | 567,270 | 423,951 | 397,215 | 407,504 | 42,123 | 2,288,063 | |||||||||||||||||||||||||||||||||||||||||||||||||||||||||||||||
Chief Financial Officer | 2013 | 375,000 | 367,499 | 269,110 | 243,750 | 47,933 | 36,599 | 1,339,891 |
| 2016
|
|
| 435,000
|
|
| —
|
|
| 495,096
|
|
| 334,559
|
|
| 494,508
|
|
| 618,576
|
|
| 41,600
|
|
| 2,419,339
|
| |||||||||||||||||||||||||||||||||||||
John J. Keane | 2015 | 405,000 | — | 449,308 | 362,930 | 283,500 | 337,997 | 34,990 | 1,873,725 | 2018 | 455,000 | — | 586,967 | 435,170 | 339,203 | — | 32,662 | 1,848,855 | ||||||||||||||||||||||||||||||||||||||||||||||||||||||
Senior Vice President | 2014 | 380,000 | 568,080 | 332,197 | 353,461 | 478,693 | 37,665 | 2,150,096 | ||||||||||||||||||||||||||||||||||||||||||||||||||||||||||||||||
Executive Vice President | 2017 | 435,000 | — | 567,270 | 423,951 | 395,850 | 161,304 | 38,577 | 2,021,952 | |||||||||||||||||||||||||||||||||||||||||||||||||||||||||||||||
|
| 2016
|
|
| 420,000
|
|
| —
|
|
| 495,096
|
|
| 334,559
|
|
| 448,056
|
|
| 473,781
|
|
| 43,015
|
|
| 2,214,507
|
| ||||||||||||||||||||||||||||||||||||||||||||||
Gregory P. Merk | 2018 | 420,000 | — | 430,967 | 313,322 | 337,428 | — | 24,764 | 1,394,239 | |||||||||||||||||||||||||||||||||||||||||||||||||||||||||||||||
Executive Vice President | 2017 | 403,000 | — | 425,453 | 302,822 | 351,799 | 364,368 | 23,766 | 1,871,208 | |||||||||||||||||||||||||||||||||||||||||||||||||||||||||||||||
|
| 2016
|
|
| 380,000
|
|
| —
|
|
| 350,693
|
|
| 260,645
|
|
| 411,996
|
|
| 483,320
|
|
| 26,570
|
|
| 1,913,224
|
| ||||||||||||||||||||||||||||||||||||||||||||||
Jeffrey A. Pembroke | 2018 | 415,000 | — | 380,743 | 292,434 | 389,789 | 37,374 | 38,794 | 1,554,134 | |||||||||||||||||||||||||||||||||||||||||||||||||||||||||||||||
Executive Vice President | ||||||||||||||||||||||||||||||||||||||||||||||||||||||||||||||||||||||||
| 2013 | 367,000 | 397,694 | 291,128 | 177,261 | — | 41,701 | 1,274,784 | |||||||||||||||||||||||||||||||||||||||||||||||||||||||||||||||||
Gregory P. Merk | 2015 | 345,000 | — | 318,020 | 240,986 | 291,249 | 204,056 | 17,904 | 1,417,215 | |||||||||||||||||||||||||||||||||||||||||||||||||||||||||||||||
Senior Vice President | 2014 | 320,000 | 273,325 | 219,539 | 282,269 | 617,601 | 30,046 | 1,742,780 | ||||||||||||||||||||||||||||||||||||||||||||||||||||||||||||||||
| 2013 | 289,000 | 256,158 | 185,930 | 128,750 | 476,663 | 166,141 | 1,502,642 | |||||||||||||||||||||||||||||||||||||||||||||||||||||||||||||||||
Douglas C. Bloomfield (7) | 2015 | 320,000 | — | 286,792 | 229,372 | 255,200 | 330,817 | 35,254 | 1,457,835 | |||||||||||||||||||||||||||||||||||||||||||||||||||||||||||||||
Vice President | ||||||||||||||||||||||||||||||||||||||||||||||||||||||||||||||||||||||||
| (1) | This column includes amounts of base salary deferred into the 2005 Deferred Compensation Plan. These deferrals are noted in footnote 1 to the |
| (2) | This column represents the |
| Named Executive Officer | Fiscal Year | Maximum Payout (Units) | Maximum Award Date Fair Value Payout ($) | Fiscal
| Maximum
| Maximum Grant Date Fair Value Payout
| ||||||||||||
Michael F. Hilton | 2015 | 30,200 | 2,309,696 | 2018 | 26,800 | $3,308,460 | ||||||||||||
| 2014 | 29,200 | 2,022,100 | 2017 | 29,800 | $3,091,750 | |||||||||||||
| 2013 | 32,000 | 1,906,880 | 2016
| 36,800
| $2,490,992
| |||||||||||||
Gregory A. Thaxton | 2015 | 7,600 | 581,248 | 2018 | 6,200 | $ 765,390 | ||||||||||||
| 2014 | 7,400 | 512,450 | 2017 | 7,200 | $ 747,000 | |||||||||||||
| 2013 | 8,200 | 488,638 | 2016
| 9,600
| $ 649,824
| |||||||||||||
John J. Keane | 2015 | 8,000 | 611,840 | 2018 | 6,200 | $ 765,390 | ||||||||||||
| 2014 | 7,800 | 540,150 | 2017 | 7,200 | $ 747,000 | |||||||||||||
| 2013 | 8,800 | 524,392 | 2016
| 9,600
| $ 649,824
| |||||||||||||
Gregory P. Merk | 2015 | 5,400 | 412,992 | 2018 | 4,500 | $ 555,525 | ||||||||||||
| 2014 | 5,200 | 360,100 | 2017 | 5,400 | $ 560,250 | |||||||||||||
| 2013 | 5,600 | 333,704 | 2016
| 6,800
| $ 460,292
| |||||||||||||
Douglas C. Bloomfield | 2015 | 5,000 | 382,400 | |||||||||||||||
Jeffrey A. Pembroke | 2018 | 4,100 | $ 506,145 | |||||||||||||||
| (3) | This column represents the |
Nordson Corporation – | | |
The table below lists the assumptions used to estimate the awardgrant date fair value of stock options awarded to the named executive officers and included in this column as of October 31, 2015:2018:
| Fiscal Year | Number of Shares Awarded | Exercise Price | Expected Life (in years) | Dividend Yield | Volatility | Risk-Free Rate | Number of Shares Awarded | Exercise Price | Expected Life (in years) | Dividend Yield | Volatility | Risk-Free Rate | ||||||||||||||||||||||||
2011 | 95,800 | $ | 43.32 | 6.3 | 1.28 | % | 0.431 | 2.25 | % | |||||||||||||||||||||||||||
2012 | 104,000 | $ | 43.73 | 6.1 | 1.20 | % | 0.454 | 1.23 | % | |||||||||||||||||||||||||||
2013 | 81,100 | $ | 61.59 | 6.1 | 1.01 | % | 0.453 | 0.90 | % | |||||||||||||||||||||||||||
2014 | 80,100 | $ | 71.75 | 6.1 | 1.03 | % | 0.442 | 1.79 | % | 76,000
| $ 71.75
| 6.1
| 1.03%
| 0.4419
| 1.78%
| |||||||||||||||||||||
2015 | 90,000 | $ | 79.66 | 6.1 | 1.10 | % | 0.395 | 1.85 | % | 85,900
| $ 79.66
| 6.1
| 1.10%
| 0.3919
| 1.84%
| |||||||||||||||||||||
2016
| 127,800
| $ 70.91
| 6.2
| 1.54%
| 0.3037
| 1.90%
| ||||||||||||||||||||||||||||||
2017
| 104,900
| $107.65
| 6.2
| 1.17%
| 0.2918
| 2.01%
| ||||||||||||||||||||||||||||||
2018
| 98,200
| $127.67
| 6.2
| 0.97%
| 0.2670
| 2.20%
| ||||||||||||||||||||||||||||||
The assumptions listed above differ slightly from those presented in Note 15,14 Stock-based Compensation in the “Notes to the consolidated financial statements included inConsolidated Financial Statements” section of our 2015 Annual Report.Form10-K for 2018. The assumptions in Note 1514 represent awards to all executive officers and key employees and awardgrant dates during each year.
See the “Grants of Plan-Based Awards” table for information with respect to the stock options awarded in 20152018 and the “Outstanding Equity Awards” table for information with respect to the stock options awarded prior to 2015.2018.
| (4) | The amounts in this column represent the totalnon-equity incentive plan compensation we recognized in the respective fiscal year under our Annual Cash Incentive Award and also include the portion of the Annual Cash Incentive Award payout that was deferred by our named executive officers. These deferrals are noted in footnote 1 to the |
| (5) | The amounts entered in this column include the aggregate change in the actuarial present value of the named executive officer’s accumulated benefits under the Nordson Corporation Salaried Employees Defined Benefit Pension Plan and Excess Defined Benefit Pension Plan. There were no above-market or preferential earnings onnon-qualified deferred compensation. The present value amounts of the accumulated benefits were determined using assumptions discussed in Note |
The following table provides further details to the increases by plan for 2015:2018:
| Named Executive Officer | Change in Pension Plan Value ($) | Change in Excess Pension Plan Value ($) | Change in Pension Plan Value ($) | Change in Excess Pension Plan Value ($) | ||||||||||||||
Michael F. Hilton | 42,006 | 719,468 |
| 37,095
|
|
| 417,651
|
| ||||||||||
Gregory A. Thaxton | 11,481 | 502,948 |
| (45,626
| )
|
| 92,886
|
| ||||||||||
John J. Keane | 14,538 | 323,459 |
| (35,831
| )
|
| 35,684
|
| ||||||||||
Gregory P. Merk | 20,778 | 183,278 |
| (2,794
| )
|
| (129,449
| )
| ||||||||||
Douglas C. Bloomfield | 14,111 | 316,706 | ||||||||||||||||
Jeffrey A. Pembroke
|
| (18,955
| )
|
| 56,329
|
| ||||||||||||
| (6) | The following tables describe each component of the “All Other Compensation” column in the Summary Compensation Table: |
| Named Executive Officer | Total Perquisites ($) (a) | Company Tax-Qualified and | Dividends Related to Share Based Plans ($) | Company Match of Charitable Contributions ($) | Total All Other Compensation ($) | Total Perquisites ($) (a) | Company Tax-Qualified and | Dividends Related to Share- Based Plans ($) | Company Match of Charitable Contributions ($) | Total All ($) | |||||||||||||||||||||||||||||||||||
Michael F. Hilton | 11,245 | 7,950 | 13,532 | 2,730 | 75,158 |
| 9,800
|
|
| 49,927
|
|
| 18,419
|
|
| 4,730
|
|
| 82,876
|
| |||||||||||||||||||||||||
Gregory A. Thaxton | 6,538 | 8,033 | 3,301 | 5,156 | 34,511 |
| 6,637
|
|
| 21,628
|
|
| 4,500
|
|
| 5,089
|
|
| 37,854
|
| |||||||||||||||||||||||||
John J. Keane | 6,606 | 9,994 | 5,221 | 4,000 | 34,990 |
| 6,681
|
|
| 21,481
|
|
| 4,500
|
|
| —
|
|
| 32,662
|
| |||||||||||||||||||||||||
Gregory P. Merk | 875 | 6,851 | 2,476 | — | 17,904 |
| 875
|
|
| 20,554
|
|
| 3,335
|
|
| —
|
|
| 24,764
|
| |||||||||||||||||||||||||
Douglas C. Bloomfield | 8,895 | 7,934 | 2,296 | 9,300 | 35,654 | ||||||||||||||||||||||||||||||||||||||||
Jeffrey A. Pembroke
|
| 4,518
|
|
| 16,951
|
|
| 2,325
|
|
| 15,000
|
|
| 38,794
|
| ||||||||||||||||||||||||||||||
| (a) | Total perquisites for |
| Named Executive Officer | Financial Planning ($) | Business Club Dues ($) | Executive Physicals ($) | Total Perquisites ($) | ||||||||||||
Michael F. Hilton | 5,000 | 4,510 | 1,735 | 11,245 | ||||||||||||
Gregory A. Thaxton | 5,000 | 500 | 1,038 | 6,538 | ||||||||||||
John J. Keane | 4,700 | — | 1,906 | 6,606 | ||||||||||||
Gregory P. Merk | 875 | — | — | 875 | ||||||||||||
Douglas C. Bloomfield | 3,900 | 400 | 4,595 | 8,895 | ||||||||||||
| Named Executive Officer | Financial Planning ($) | Business and Airline Club Dues ($) | Executive Physicals ($) | Total ($) | ||||||||||||||||
Michael F. Hilton
|
| 5,000
|
|
| 4,800
|
|
| —
|
|
| 9,800
|
| ||||||||
Gregory A. Thaxton
|
| 4,000
|
|
| 1,250
|
|
| 1,387
|
|
| 6,637
|
| ||||||||
John J. Keane
|
| 4,300
|
|
| —
|
|
| 2,381
|
|
| 6,681
|
| ||||||||
Gregory P. Merk
|
| 875
|
|
| —
|
|
| —
|
|
| 875
|
| ||||||||
Jeffrey A. Pembroke
|
| 2,400
|
|
| —
|
|
| 2,118
|
|
| 4,518
|
| ||||||||
| Nordson Corporation – |
We awardedgranted the following awards to our executive officers in 2015:2018:
Annual Cash Incentive Awards — The Compensation Committee establishes quantitative corporate financial and operating unit measures and performance levelsgoals at the beginning of a fiscal year. Any payouts are determined by actual fiscal year performance against thepre-established corporate financial and business operating performance measures (forfor our named executive officers that lead our businesses). Payout amountsbusinesses. These awards are referred to in the following table as “CIA.“ACIA.”
Performance Share Incentive Awards — The Compensation Committee establishes performance share incentive awards for executive officers based on three-year cumulative performance measures. The award is in the form of performance share units which are settled in unrestricted Nordson common shares on aone-for-one basis or share equivalent units on aone-for-one basis for payouts that are deferred. The payout will vary based upon the actual level of performance over a three-year period. However, the threshold performance level must be achieved before any payout is made. These awards are referred to in the following table as “PSIA.”
Restricted Share Awards — Restricted shares are awarded subject to restrictions on transferability. The shares may be voted but not sold or transferred during the restriction period. Cash dividends are paid on the restricted shares during the restriction period. Restricted shares vest on apro-rata basis annually each year for three years following the date of award. These awards are referred to in the following table as “RS.”
Stock Option Awards — Stock options have a term of ten years, become exercisable over a four-year period at the rate of 25% per year beginning one year from the awardgrant date, and have an exercise price equal to the closing price of our common shares on the awardgrant date. Under the terms of award, the exercise price andtax-withholding obligations may be paid with previously owned common shares or with shares acquired upon exercise. Information with respect to each of these awards on anaward-by-award basis is set forth in the table below. These awards are referred to in the following table as “Options.”
The impact of a termination of employment of an executive officer on these plan-based awards is addressed in the “Potential Benefits Upon Termination” section of this Proxy Statement.
Nordson Corporation – | | |
Grants of Plan-Based Awards
The following table and footnotes present the components of the plan-based awards made to our named executive officers during 2015.2018.
Grants of Plan-Based Awards Table
| Estimated Future Payouts Under Non-equity Incentive Plan Awards (1) | Estimated Future Payouts Under Equity Incentive Plan Awards (2) | All Other (#)
| All Other (#)
| Exercise ($/sh)
| Award ($)
| |||||||||||||||||||||||||||||||||||||||||||||||||||||||||||||||||||||||||||||||||||||||
| Threshold | Target | Maximum | Threshold | Target | Maximum |
Estimated Future Payouts Under |
Estimated Future Payouts | All Other (#) | All Other (#) | Exercise ($/sh) | Grant Fair Value ($) | |||||||||||||||||||||||||||||||||||||||||||||||||||||||||||||||||||||||||||||||||
| Name | Plan | Award Date | ($) | ($) | ($) | (#) | (#) | (#) | Plan
| Grant Date
| Threshold ($)
| Target ($)
| Maximum ($)
| Threshold (#)
| Target (#)
| Maximum (#)
| ||||||||||||||||||||||||||||||||||||||||||||||||||||||||||||||||||||||||||||
Hilton | CIA | 11/24/2014 | 412,500 | 825,000 | 1,650,000 | — | — | — | — | — | — | — | ACIA | 11/20/2017 | 462,500 | 925,000 | 1,850,000 | — | — | — | — | — | — | — | ||||||||||||||||||||||||||||||||||||||||||||||||||||||||||||||||||||
| PSIA | 11/24/2014 | — | — | — | 7,550 | 15,100 | 30,200 | — | — | — | 1,154,848 | PSIA | 11/20/2017 | — | — | — | 6,700 | 13,400 | 26,800 | — | — | — | 1,654,230 | |||||||||||||||||||||||||||||||||||||||||||||||||||||||||||||||||||||
| RS | 11/24/2014 | — | — | — | — | — | — | 7,500 | — | — | 597,450 | RS | 11/20/2017 | — | — | — | — | — | — | 6,700 | — | — | 855,389 | |||||||||||||||||||||||||||||||||||||||||||||||||||||||||||||||||||||
| Options | 11/24/2014 | — | — | — | — | — | — | — | 49,100 | $ | 79.66 | 1,425,589 | Options | 11/20/2017 | — | — | — | — | — | — | — | 55,800 | $ | 127.67 | 1,942,599 | |||||||||||||||||||||||||||||||||||||||||||||||||||||||||||||||||||
Thaxton | CIA | 11/24/2014 | 147,000 | 294,000 | 588,000 | — | — | — | — | — | — | — | ACIA | 11/20/2017 | 164,500 | 329,000 | 658,000 | — | — | — | — | — | — | — | ||||||||||||||||||||||||||||||||||||||||||||||||||||||||||||||||||||
| PSIA | 11/24/2014 | — | — | — | 1,900 | 3,800 | 7,600 | — | — | — | 290,624 | PSIA | 11/20/2017 | — | — | — | 1,550 | 3,100 | 6,200 | — | — | — | 382,695 | |||||||||||||||||||||||||||||||||||||||||||||||||||||||||||||||||||||
| RS | 11/24/2014 | — | — | — | — | — | — | 1,800 | — | — | 143,388 | RS | 11/20/2017 | — | — | — | — | — | — | 1,600 | — | — | 204,272 | |||||||||||||||||||||||||||||||||||||||||||||||||||||||||||||||||||||
| Options | 11/24/2014 | — | — | — | — | — | — | — | 12,200 | $ | 79.66 | 354,220 | Options | 11/20/2017 | — | — | — | — | — | — | — | 12,500 | $ | 127.67 | 435,170 | |||||||||||||||||||||||||||||||||||||||||||||||||||||||||||||||||||
Keane | CIA | 11/24/2014 | 141,750 | 283,500 | 567,000 | — | — | — | — | — | — | — | ACIA | 11/20/2017 | 159,250 | 318,500 | 637,000 | — | — | — | — | — | — | — | ||||||||||||||||||||||||||||||||||||||||||||||||||||||||||||||||||||
| PSIA | 11/24/2014 | — | — | — | 2,000 | 4,000 | 8,000 | — | — | — | 305,920 | PSIA | 11/20/2017 | — | — | — | 1,550 | 3,100 | 6,200 | — | — | — | 382,695 | |||||||||||||||||||||||||||||||||||||||||||||||||||||||||||||||||||||
| RS | 11/24/2014 | — | — | — | — | — | — | 1,800 | — | — | 143,388 | RS | 11/20/2017 | — | — | — | — | — | — | 1,600 | — | — | 204,272 | |||||||||||||||||||||||||||||||||||||||||||||||||||||||||||||||||||||
| Options | 11/24/2014 | — | — | — | — | — | — | — | 12,500 | $ | 79.66 | 362,930 | Options | 11/20/2017 | — | — | — | — | — | — | — | 12,500 | $ | 127.67 | 435,170 | |||||||||||||||||||||||||||||||||||||||||||||||||||||||||||||||||||
Merk | CIA | 11/24/2014 | 103,500 | 207,000 | 414,000 | — | — | — | — | — | — | — | ACIA | 11/20/2017 | 136,500 | 273,000 | 546,000 | — | — | — | — | — | — | — | ||||||||||||||||||||||||||||||||||||||||||||||||||||||||||||||||||||
| PSIA | 11/24/2014 | — | — | — | 1,350 | 2,700 | 5,400 | — | — | — | 206,496 | PSIA | 11/20/2017 | — | — | — | 1,125 | 2,250 | 4,500 | — | — | — | 277,763 | |||||||||||||||||||||||||||||||||||||||||||||||||||||||||||||||||||||
| RS | 11/24/2014 | — | — | — | — | — | — | 1,400 | — | — | 111,524 | RS | 11/20/2017 | — | — | — | — | — | — | 1,200 | — | — | 153,204 | |||||||||||||||||||||||||||||||||||||||||||||||||||||||||||||||||||||
| Options | 11/24/2014 | — | — | — | — | — | — | — | 8,300 | $ | 79.66 | 240,986 | Options | 11/20/2017 | — | — | — | — | — | — | — | 9,000 | $ | 127.67 | 313,322 | |||||||||||||||||||||||||||||||||||||||||||||||||||||||||||||||||||
Bloomfield | CIA | 11/24/2014 | 88,000 | 176,000 | 352,000 | — | — | — | — | — | — | — | ||||||||||||||||||||||||||||||||||||||||||||||||||||||||||||||||||||||||||||||||
Pembroke | ACIA | 11/20/2017 | 134,875 | 269,750 | 539,500 | — | — | — | — | — | — | — | ||||||||||||||||||||||||||||||||||||||||||||||||||||||||||||||||||||||||||||||||
| PSIA | 11/24/2014 | — | — | — | 1,250 | 2,500 | 5,000 | — | — | — | 191,200 | PSIA | 11/20/2017 | — | — | — | 1,025 | 2,050 | 4,100 | — | — | — | 253,073 | |||||||||||||||||||||||||||||||||||||||||||||||||||||||||||||||||||||
| RS | 11/24/2014 | — | — | — | — | — | — | 1,200 | — | — | 95,592 | RS | 11/20/2017 | — | — | — | — | — | — | 1,000 | — | — | 127,670 | |||||||||||||||||||||||||||||||||||||||||||||||||||||||||||||||||||||
| Options | 11/24/2014 | — | — | — | — | — | — | — | 7,900 | $ | 79.66 | 229,372 | Options
|
| 11/20/2017
|
|
| —
|
|
| —
|
|
| —
|
|
| —
|
|
| —
|
|
| —
|
|
| —
|
|
| 8,400
|
| $
| 127.67
|
|
| 292,434
|
| ||||||||||||||||||||||||||||||||||||||||||||||
| (1) | These columns show the estimated dollar value of the potential payout under the |
| (2) | These columns show the potential number of shares to be paid out for our named executive officers under the PSIA at threshold, target, or maximum performance. The measures and potential payouts are described in more detail in Part III of the Compensation Discussion and Analysis section of this Proxy Statement under the caption “Key Components of Our Executive Compensation Program.” The |
| (3) | Values in this column reflect the |
For establishing |
| a. | Expected Volatility: |
| b. | Risk-Free Interest Rate: The rate available at the time the award was made onzero-coupon U.S. Government issues with a remaining term equal to the expected life: |
| c. | Dividend Yield: |
| d. | Expected Life: |
The calculations for the fair value of restricted shares are based upon the |
| Nordson Corporation – |
OUTSTANDING EQUITY AWARDS AT OCTOBER 31, 20152018
The following narrative, table and footnotes describe equity awards to our named executive officers under our Amended and Restated 2012 Stock Incentive and Award Plan that were outstanding as of the end of 2015:2018:
2014-20162017-2019 Performance Share Incentive Awards (disclosed as “2014“2017 PSIA” awards in the “Stock Awards” columns). The 2014-20162017-2019 performance period began November 1, 20132016 and concludes October 31, 2016.2019. Settlement of these awards will be in the form of unrestricted Nordson common shares on aone-for-one basis. The ultimate value of the awards will depend on the number of share units earned and the price of our common shares at the time of settlement.
2015-20172018-2020 Performance Share Incentive Awards (disclosed as “2015“2018 PSIA” awards in the “Stock Awards” columns). The 2015-20172018-2020 performance period began November 1, 20142017 and concludes October 31, 2017.2020. Settlement of these awards will be in the form of unrestricted Nordson common shares on aone-for-one basis. The ultimate value of the awards will depend on the number of share units earned and the price of our common shares at the time of settlement.
Restricted Share Awards (disclosed in the “Stock Awards” columns).Consist of the unvested restricted shares as of October 31, 2015. Restricted shares vest on a pro-rata basis annually each year for three years following the date of award.2018.
Stock Option Awards (disclosed in the “Option Awards” columns). Consist of outstanding stock options awarded to our named executive officers. Stock options have a term of ten years and become exercisable over a four year period at the rate of 25% per year, beginning one year from the award date.
Nordson Corporation – | | |
Outstanding Equity Awards
The following table sets forth information with respect to performance share awards, restricted share awards and stock options held by our named executive officers as of October 31, 2015.2018. Dates noted below the names of the named executive officers represent award dates for stock options and restricted shares.
| Option Awards | Stock Awards | ||||||||||||||||||||||||||||||
| Name | Number of Securities Underlying Unexer- cised Options - Exercis- able (1) (#) | Number of Securities Underlying Unexer- cised Options- Unexercis- able (1) (#) | Option Exercise Price $/sh | Option Expiration Date | Number of Shares or Units of Stock That Have Not Vested (2) (#) | Market Value of Shares or Units of Stock That Have Not Vested (2) ($) | Equity Incentive Plan Awards: Number of Unearned Shares, Units or Other Rights Not Vested (3) (#) | Equity Incentive Plan Awards: Market or Payout Value of Unearned Shares, Units or Other Rights Not Vested (4) ($) | ||||||||||||||||||||||||
Michael F. Hilton | ||||||||||||||||||||||||||||||||
2014 PSIA | — | — | — | — | — | — | 29,200 | 2,080,208 | ||||||||||||||||||||||||
2015 PSIA | — | — | — | — | — | — | 30,200 | 2,151,448 | ||||||||||||||||||||||||
Restricted Shares | ||||||||||||||||||||||||||||||||
28-Nov-2012 | — | — | — | — | 2,668 | 190,068 | — | — | ||||||||||||||||||||||||
25-Nov-2013 | — | — | — | — | 4,867 | 346,725 | — | — | ||||||||||||||||||||||||
24-Nov-2014 | — | — | — | — | 7,500 | 534,300 | — | — | ||||||||||||||||||||||||
Stock Options: | ||||||||||||||||||||||||||||||||
16-Jan-2010 (5) | 69,218 | — | 30.70 | 16-Jan-2020 | — | — | — | — | ||||||||||||||||||||||||
7-Dec-2010 | 50,000 | — | 43.32 | 07-Dec-2020 | — | — | — | — | ||||||||||||||||||||||||
28-Nov-2011 | 41,250 | 13,750 | 43.73 | 28-Nov-2021 | — | — | — | — | ||||||||||||||||||||||||
28-Nov-2012 | 21,500 | 21,500 | 61.59 | 28-Nov-2022 | — | — | — | — | ||||||||||||||||||||||||
25-Nov-2013 | 10,675 | 32,025 | 71.75 | 25-Nov-2023 | — | — | — | — | ||||||||||||||||||||||||
24-Nov-2014 | — | 49,100 | 79.66 | 24-Nov-2024 | — | — | — | — | ||||||||||||||||||||||||
Gregory A. Thaxton | ||||||||||||||||||||||||||||||||
2014 PSIA | — | — | — | — | — | — | 7,400 | 527,176 | ||||||||||||||||||||||||
2015 PSIA | — | — | — | — | — | — | 7,600 | 541,424 | ||||||||||||||||||||||||
Restricted Shares | ||||||||||||||||||||||||||||||||
28-Nov-2012 | — | — | — | — | 668 | 47,588 | — | — | ||||||||||||||||||||||||
25-Nov-2013 | — | — | — | — | 1,200 | 85,488 | — | — | ||||||||||||||||||||||||
24-Nov-2014 | — | — | — | — | 1,800 | 128,232 | — | — | ||||||||||||||||||||||||
Stock Options: | ||||||||||||||||||||||||||||||||
5-Dec-2007 | 4,800 | — | 26.46 | 5-Dec-2017 | — | — | — | — | ||||||||||||||||||||||||
4-Dec-2008 | 7,475 | — | 14.37 | 4-Dec-2018 | — | — | — | — | ||||||||||||||||||||||||
3-Dec-2009 | 11,250 | — | 27.26 | 3-Dec-2019 | — | — | — | — | ||||||||||||||||||||||||
7-Dec-2010 | 11,400 | — | 43.32 | 7-Dec-2020 | — | — | — | — | ||||||||||||||||||||||||
28-Nov-2011 | 9,750 | 3,250 | 43.73 | 28-Nov-2021 | — | — | — | — | ||||||||||||||||||||||||
28-Nov-2012 | 5,500 | 5,500 | 61.59 | 28-Nov-2022 | — | — | — | — | ||||||||||||||||||||||||
25-Nov-2013 | 2,750 | 8,250 | 71.75 | 25-Nov-2023 | — | — | — | — | ||||||||||||||||||||||||
24-Nov-2014 | — | 12,200 | 79.66 | 24-Nov-2024 | — | — | — | — | ||||||||||||||||||||||||
John J. Keane | ||||||||||||||||||||||||||||||||
2014 PSIA | — | — | — | — | — | — | 7,800 | 555,672 | ||||||||||||||||||||||||
2015 PSIA | — | — | — | — | — | — | 8,000 | 569,920 | ||||||||||||||||||||||||
Restricted Shares | ||||||||||||||||||||||||||||||||
28-Nov-2012 | — | — | — | — | 734 | 52,290 | — | — | ||||||||||||||||||||||||
25-Nov-2013 | — | — | — | — | 1,267 | 90,261 | — | — | ||||||||||||||||||||||||
27-Aug-2014 (6) | — | — | — | — | 2,000 | 142,480 | — | — | ||||||||||||||||||||||||
24-Nov-2014 | — | — | — | — | 1,800 | 128,232 | — | — | ||||||||||||||||||||||||
Stock Options: | ||||||||||||||||||||||||||||||||
5-Dec-2007 | 6,900 | — | 26.46 | 5-Dec-2017 | — | — | — | — | ||||||||||||||||||||||||
3-Dec-2009 | 23,600 | — | 27.26 | 3-Dec-2019 | — | — | — | — | ||||||||||||||||||||||||
7-Dec-2010 | 16,000 | — | 43.32 | 7-Dec-2020 | — | — | — | — | ||||||||||||||||||||||||
28-Nov-2011 | 12,000 | 4,000 | 43.73 | 28-Nov-2021 | — | — | — | — | ||||||||||||||||||||||||
28-Nov-2012 | 5,950 | 5,950 | 61.59 | 28-Nov-2022 | — | — | — | — | ||||||||||||||||||||||||
25-Nov-2013 | 2,875 | 8,625 | 71.75 | 25-Nov-2023 | — | — | — | — | ||||||||||||||||||||||||
24-Nov-2014 | — | 12,500 | 79.66 | 24-Nov-2024 | — | — | — | — | ||||||||||||||||||||||||
| Option Awards | Stock Awards | ||||||||||||||||||||||||||||||
Name
| Number of
| Number of
| Option
| Option Date
| Number of That Not
| Market Not
| Equity Awards: Units
| Equity Incentive Awards:
| ||||||||||||||||||||||||
Michael F. Hilton | ||||||||||||||||||||||||||||||||
2017 PSIA | — | — | — | — | — | — | 29,800 | 3,655,566 | ||||||||||||||||||||||||
2018 PSIA | — | — | — | — | — | — | 26,800 | 3,287,556 | ||||||||||||||||||||||||
Restricted Shares: | ||||||||||||||||||||||||||||||||
23-Nov-2015 | — | — | — | — | 3,068 | 376,352 | — | — | ||||||||||||||||||||||||
21-Nov-2016 | — | — | — | — | 4,967 | 609,302 | — | — | ||||||||||||||||||||||||
20-Nov-2017 | — | — | — | — | 6,700 | 821,889 | — | — | ||||||||||||||||||||||||
Stock Options: | ||||||||||||||||||||||||||||||||
28-Nov-2012 | 43,000 | — | 61.59 | 28-Nov-2022 | — | — | — | — | ||||||||||||||||||||||||
25-Nov-2013 | 42,700 | — | 71.75 | 25-Nov-2023 | — | — | — | — | ||||||||||||||||||||||||
24-Nov-2014 | 36,825 | 12,275 | 79.66 | 24-Nov-2024 | — | — | — | — | ||||||||||||||||||||||||
23-Nov-2015 | 36,400 | 36,400 | 70.91 | 23-Nov-2025 | — | — | — | — | ||||||||||||||||||||||||
21-Nov-2016 | 15,100 | 45,300 | 107.65 | 21-Nov-2026 | — | — | — | — | ||||||||||||||||||||||||
20-Nov-2017 | — | 55,800 | 127.67 | 20-Nov-2027 | — | — | — | — | ||||||||||||||||||||||||
Gregory A. Thaxton | ||||||||||||||||||||||||||||||||
2017 PSIA | — | — | — | — | — | — | 7,200 | 883,224 | ||||||||||||||||||||||||
2018 PSIA | — | — | — | — | — | — | 6,200 | 760,554 | ||||||||||||||||||||||||
Restricted Shares: | ||||||||||||||||||||||||||||||||
23-Nov-2015 | — | — | — | — | 800 | 98,136 | — | — | ||||||||||||||||||||||||
21-Nov-2016 | — | — | — | — | 1,200 | 147,204 | — | — | ||||||||||||||||||||||||
20-Nov-2017 | — | — | — | — | 1,600 | 196,272 | — | — | ||||||||||||||||||||||||
Stock Options: | ||||||||||||||||||||||||||||||||
3-Dec-2009 | 11,250 | — | 27.26 | 3-Dec-2019 | — | — | — | — | ||||||||||||||||||||||||
7-Dec-2010 | 11,400 | — | 43.32 | 7-Dec-2020 | — | — | — | — | ||||||||||||||||||||||||
28-Nov-2011 | 13,000 | — | 43.73 | 28-Nov-2021 | — | — | — | — | ||||||||||||||||||||||||
28-Nov-2012 | 11,000 | — | 61.59 | 28-Nov-2022 | — | — | — | — | ||||||||||||||||||||||||
25-Nov-2013 | 11,000 | — | 71.75 | 25-Nov-2023 | — | — | — | — | ||||||||||||||||||||||||
24-Nov-2014 | 9,150 | 3,050 | 79.66 | 24-Nov-2024 | — | — | — | — | ||||||||||||||||||||||||
23-Nov-2015 | 8,600 | 8,600 | 70.91 | 23-Nov-2025 | — | — | — | — | ||||||||||||||||||||||||
21-Nov-2016 | 3,500 | 10,500 | 107.65 | 21-Nov-2026 | — | — | — | — | ||||||||||||||||||||||||
20-Nov-2017 | — | 12,500 | 127.67 | 20-Nov-2027 | — | — | — | — | ||||||||||||||||||||||||
John J. Keane | ||||||||||||||||||||||||||||||||
2017 PSIA | — | — | — | — | — | — | 7,200 | 883,224 | ||||||||||||||||||||||||
2018 PSIA | — | — | — | — | — | — | 6,200 | 760,554 | ||||||||||||||||||||||||
Restricted Shares: | ||||||||||||||||||||||||||||||||
23-Nov-2015 | — | — | — | — | 800 | 98,136 | — | — | ||||||||||||||||||||||||
21-Nov-2016 | — | — | — | — | 1,200 | 147,204 | — | — | ||||||||||||||||||||||||
20-Nov-2017 | — | — | — | — | 1,600 | 196,272 | — | — | ||||||||||||||||||||||||
Stock Options: | ||||||||||||||||||||||||||||||||
7-Dec-2010 | 16,000 | — | 43.32 | 7-Dec-2020 | — | — | — | — | ||||||||||||||||||||||||
28-Nov-2011 | 16,000 | — | 43.73 | 28-Nov-2021 | — | — | — | — | ||||||||||||||||||||||||
28-Nov-2012 | 11,900 | — | 61.59 | 28-Nov-2022 | — | — | — | — | ||||||||||||||||||||||||
25-Nov-2013 | 11,500 | — | 71.75 | 25-Nov-2023 | — | — | — | — | ||||||||||||||||||||||||
24-Nov-2014 | 9,375 | 3,125 | 79.66 | 24-Nov-2024 | — | — | — | — | ||||||||||||||||||||||||
23-Nov-2015 | 8,600 | 8,600 | 70.91 | 23-Nov-2025 | — | — | — | — | ||||||||||||||||||||||||
21-Nov-2016 | 3,500 | 10,500 | 107.65 | 21-Nov-2026 | — | — | — | — | ||||||||||||||||||||||||
20-Nov-2017 | — | 12,500 | 127.67 | 20-Nov-2027 | — | — | — | — | ||||||||||||||||||||||||
| Nordson Corporation – |
| Option Awards | Stock Awards | ||||||||||||||||||||||||||||||
| Name | Number of Securities Underlying Unexer- cised Options - Exercis- able (1) (#) | Number of Securities Underlying Unexer- cised Options- Unexercis- able (1) (#) | Option Exercise Price $/sh | Option Expiration Date | Number of Shares or Units of Stock That Have Not Vested (2) (#) | Market Value of Shares or Units of Stock That Have Not Vested (2) ($) | Equity Incentive Plan Awards: Number of Unearned Shares, Units or Other Rights Not Vested (3) (#) | Equity Incentive Plan Awards: Market or Payout Value of Unearned Shares, Units or Other Rights Not Vested (4) ($) | ||||||||||||||||||||||||
Gregory P. Merk | ||||||||||||||||||||||||||||||||
2014 PSIA | — | — | — | — | — | — | 5,200 | 370,448 | ||||||||||||||||||||||||
2015 PSIA | — | — | — | — | — | — | 5,400 | 384,696 | ||||||||||||||||||||||||
Restricted Shares | ||||||||||||||||||||||||||||||||
28-Nov-2012 | — | — | — | — | 484 | 34,480 | — | — | ||||||||||||||||||||||||
25-Nov-2013 | — | — | — | — | 867 | 61,765 | — | — | ||||||||||||||||||||||||
24-Nov-2014 | — | — | — | — | 1,400 | 99,736 | — | — | ||||||||||||||||||||||||
Stock Options: | ||||||||||||||||||||||||||||||||
22-Nov-2006 | 7,000 | — | 24.39 | 22-Nov-2016 | — | — | — | — | ||||||||||||||||||||||||
5-Dec-2007 | 13,600 | — | 26.46 | 5-Dec-2017 | — | — | — | — | ||||||||||||||||||||||||
4-Dec-2008 | 22,800 | — | 14.37 | 4-Dec-2018 | — | — | — | — | ||||||||||||||||||||||||
3-Dec-2009 | 12,200 | — | 27.26 | 3-Dec-2019 | — | — | — | — | ||||||||||||||||||||||||
7-Dec-2010 | 9,000 | — | 43.32 | 7-Dec-2020 | — | — | — | — | ||||||||||||||||||||||||
28-Nov-2011 | 7,500 | 2,500 | 43.73 | 28-Nov-2021 | — | — | — | — | ||||||||||||||||||||||||
28-Nov-2012 | 3,800 | 3,800 | 61.59 | 28-Nov-2022 | — | — | — | — | ||||||||||||||||||||||||
25-Nov-2013 | 1,900 | 5,700 | 71.75 | 25-Nov-2023 | — | — | — | — | ||||||||||||||||||||||||
24-Nov-2014 | — | 8,300 | 79.66 | 24-Nov-2024 | — | — | — | — | ||||||||||||||||||||||||
Douglas C. Bloomfield | ||||||||||||||||||||||||||||||||
2014 PSIA | — | — | — | — | — | — | 5,000 | 356,200 | ||||||||||||||||||||||||
2015 PSIA | — | — | — | — | — | — | 5,000 | 356,200 | ||||||||||||||||||||||||
Restricted Shares | ||||||||||||||||||||||||||||||||
28-Nov-2012 | — | — | — | — | 484 | 34,480 | — | — | ||||||||||||||||||||||||
25-Nov-2013 | — | — | — | — | 867 | 61,765 | — | — | ||||||||||||||||||||||||
24-Nov-2014 | — | — | — | — | 1,200 | 85,488 | — | — | ||||||||||||||||||||||||
Stock Options: | ||||||||||||||||||||||||||||||||
7-Dec-2010 | 9,400 | — | 43.32 | 7-Dec-2020 | — | — | — | — | ||||||||||||||||||||||||
28-Nov-2011 | 7,500 | 2,500 | 43.73 | 28-Nov-2021 | — | — | — | — | ||||||||||||||||||||||||
28-Nov-2012 | 3,800 | 3,800 | 61.59 | 28-Nov-2022 | — | — | — | — | ||||||||||||||||||||||||
25-Nov-2013 | 1,825 | 5,475 | 71.75 | 25-Nov-2023 | — | — | — | — | ||||||||||||||||||||||||
24-Nov-2014 | — | 7,900 | 79.66 | 24-Nov-2024 | — | — | — | — | ||||||||||||||||||||||||
| Option Awards | Stock Awards | ||||||||||||||||||||||||||||||
Name
| Number of
| Number of
| Option
| Option Date
| Number of That Not
| Market Not
| Equity Awards: Units
| Equity Incentive Awards:
| ||||||||||||||||||||||||
Gregory P. Merk | ||||||||||||||||||||||||||||||||
2017 PSIA | — | — | — | — | — | — | 5,400 | 662,418 | ||||||||||||||||||||||||
2018 PSIA | — | — | — | — | — | — | 4,500 | 552,015 | ||||||||||||||||||||||||
Restricted Shares: | ||||||||||||||||||||||||||||||||
23-Nov-2015 | — | — | — | — | 568 | 69,677 | — | — | ||||||||||||||||||||||||
21-Nov-2016 | — | — | — | — | 900 | 110,403 | — | — | ||||||||||||||||||||||||
20-Nov-2017 | — | — | — | — | 1,200 | 147,204 | — | — | ||||||||||||||||||||||||
Stock Options: | ||||||||||||||||||||||||||||||||
7-Dec-2010 | 9,000 | — | 43.32 | 7-Dec-2020 | — | — | — | — | ||||||||||||||||||||||||
28-Nov-2011 | 10,000 | — | 43.73 | 28-Nov-2021 | — | — | — | — | ||||||||||||||||||||||||
28-Nov-2012 | 7,600 | — | 61.59 | 28-Nov-2022 | — | — | — | — | ||||||||||||||||||||||||
25-Nov-2013 | 7,600 | — | 71.75 | 25-Nov-2023 | — | — | — | — | ||||||||||||||||||||||||
24-Nov-2014 | 6,225 | 2,075 | 79.66 | 24-Nov-2024 | — | — | — | — | ||||||||||||||||||||||||
23-Nov-2015 | 6,700 | 6,700 | 70.91 | 23-Nov-2025 | — | — | — | — | ||||||||||||||||||||||||
21-Nov-2016 | 2,500 | 7,500 | 107.65 | 21-Nov-2026 | — | — | — | — | ||||||||||||||||||||||||
20-Nov-2017 | — | 9,000 | 127.67 | 20-Nov-2027 | — | — | — | — | ||||||||||||||||||||||||
Jeffrey A. Pembroke | ||||||||||||||||||||||||||||||||
2017 PSIA | — | — | — | — | — | — | 3,360 | 412,171 | ||||||||||||||||||||||||
2018 PSIA | — | — | — | — | — | — | 4,100 | 502,947 | ||||||||||||||||||||||||
Restricted Shares: | ||||||||||||||||||||||||||||||||
23-Nov-2015 | — | — | — | — | 300 | 36,801 | — | — | ||||||||||||||||||||||||
21-Nov-2016 | — | — | — | — | 560 | 68,695 | — | — | ||||||||||||||||||||||||
20-Nov-2017 | — | — | — | — | 1,000 | 122,670 | — | — | ||||||||||||||||||||||||
Stock Options: | ||||||||||||||||||||||||||||||||
25-Nov-2013 | 3,200 | — | 71.75 | 25-Nov-2023 | — | — | — | — | ||||||||||||||||||||||||
24-Nov-2014 | 2,850 | 950 | 79.66 | 24-Nov-2024 | — | — | — | — | ||||||||||||||||||||||||
23-Nov-2015 | 3,600 | 3,600 | 70.91 | 23-Nov-2025 | — | — | — | — | ||||||||||||||||||||||||
21-Nov-2016 | 1,625 | 4,875 | 107.65 | 21-Nov-2026 | — | — | — | — | ||||||||||||||||||||||||
20-Nov-2017 | — | 8,400 | 127.67 | 20-Nov-2027 | — | — | — | — | ||||||||||||||||||||||||
| (1) | Amounts in these columns represent outstanding vested and unvested stock options awarded from |
| (2) | Amounts in these columns represent restricted share awards that have not vested as of October 31, |
| (3) | This column reflects performance share units awarded in |
| (4) | The |
Nordson Corporation – | | |
STOCK OPTION EXERCISES AND STOCK VESTED TABLES
The following tables set forth information with respect to the stock options exercised, restricted shares vested and the Performance Share Incentive Award payout during 2015,earned, before payment of any applicable withholding tax and broker commissions.
| Stock Option | 2013-2015 PSIA Payout | Stock Option | 2016-2018 PSIA Payout | |||||||||||||||||||||||||||||||||
| Named Executive Officer | Number of Shares Acquired (#) | Value Realized ($) | Number of Shares Acquired (#) | Value Realized ($) (1) | Number of Shares Acquired on Exercise (#) | Value Realized on Exercise ($) | Number of Shares Earned (#) | Value ($) (1) | ||||||||||||||||||||||||||||
Michael F. Hilton | — | — | 18,432 | 1,167,667 | 105,000 | $ | 9,883,940 | 34,095 | 3,844,552 | |||||||||||||||||||||||||||
Gregory A. Thaxton | 5,625 | 300,119 | 4,723 | 299,202 | 7,475 | $ | 1,002,472 | 8,894 | 1,002,887 | |||||||||||||||||||||||||||
John J. Keane | — | — | 5,069 | 321,121 | — | — | 8,894 | 1,002,887 | ||||||||||||||||||||||||||||
Gregory P. Merk | 8,600 | 500,677 | 3,226 | 204,367 | 12,200 | $ | 1,497,794 | 6,300 | 710,388 | |||||||||||||||||||||||||||
Douglas C. Bloomfield | 25,800 | 1,295,845 | 3,226 | 204,367 | ||||||||||||||||||||||||||||||||
Jeffrey A. Pembroke | — | — | 3,335 | 376,055 | ||||||||||||||||||||||||||||||||
| (1) | Settlement of performance |
| Restricted Shares (Vested 11/28/14) (1) | Restricted Shares (Vested 11/28/14) (2) | Restricted Shares (Vested 11/25/14) (3) | Restricted Shares (Vested 11/24/17) (1) | Restricted Shares (Vested 11/23/17) (2) | Restricted Shares (Vested 11/30/17) (3) | |||||||||||||||||||||||||||||||||||||||||||||||||
| Named Executive Officer | Number of Shares Acquired on Vesting (#) | Value Realized on Vesting ($) (4) | Number of Shares Acquired on Vesting (#) | Value Realized on Vesting ($) (4) | Number of Shares Acquired on Vesting (#) | Value Realized on Vesting ($) (4) | Number of Shares Acquired on Vesting (#) | Value Realized on Vesting ($) (4) (a) | Number of Shares Acquired on Vesting (#) | Value Realized on Vesting ($) (4) (b) | Number of Shares Acquired on Vesting (#) | Value Realized on Vesting ($) (5) | ||||||||||||||||||||||||||||||||||||||||||
Michael F. Hilton | 3,334 | 260,552 | 2,666 | 208,348 | 2,433 | 193,934 | 2,500 | $ | 315,663 | 3,066 | $ | 393,352 | 2,483 | $ | 318,718 | |||||||||||||||||||||||||||||||||||||||
Gregory A. Thaxton | 768 | 60,019 | 666 | 52,048 | 600 | 47,826 | 600 | $ | 75,759 | 800 | $ | 102,636 | 600 | $ | 77,016 | |||||||||||||||||||||||||||||||||||||||
John J. Keane | 1,000 | 78,150 | 733 | 57,284 | 633 | 50,456 | 600 | $ | 75,759 | 800 | $ | 102,636 | 600 | $ | 77,016 | |||||||||||||||||||||||||||||||||||||||
Gregory P. Merk | 600 | 46,890 | 483 | 37,746 | 433 | 34,514 | 468 | $ | 59,092 | 566 | $ | 72,615 | 450 | $ | 57,762 | |||||||||||||||||||||||||||||||||||||||
Douglas C. Bloomfield | 600 | 46,890 | 483 | 37,746 | 433 | 34,514 | ||||||||||||||||||||||||||||||||||||||||||||||||
Jeffrey A. Pembroke | — | — | 300 | $ | 38,489 | 280 | $ | 35,941 | ||||||||||||||||||||||||||||||||||||||||||||||
| (1) | These restricted shares were awarded November |
| (2) | These restricted shares were awarded November |
| (3) | These restricted shares were awarded November |
| (4) | Value realized was calculated by multiplying the |
| (a) | November |
| (b) | November |
| (5) | Value realized was calculated by multiplying closing price of our common shares on November 30, 2017 ($128.36 per share) by the number of shares that vested. |
| Nordson Corporation – |
The following narrative, table narrative and footnotes set forth the actuarial present value of, and other information about, the pension benefits accumulated by each of our named executive officers for 2015.2018.
| Named Executive Officer | Plan Name | Number of Years | Present Value of Accumulated Benefit (1)(2) ($) | Payments During Last | Plan Name | Number of Years | Present Value of Accumulated Benefit (1)(2) ($) | Payments During Last Fiscal Year ($) | |||||||||||||||||||||||
Michael F. Hilton | Salaried Employees Pension Plan | 5.75 | 243,519 | — | Salaried Employees Pension Plan | 8.75 | 418,465 | — | |||||||||||||||||||||||
| Excess Defined Benefit Pension Plan | 5.75 | 2,315,207 | — | Excess Defined Benefit Pension Plan | 8.75 | 3,876,129 | — | ||||||||||||||||||||||||
Gregory A. Thaxton | Salaried Employees Pension Plan | 26.0 | 866,183 | — | Salaried Employees Pension Plan | 29.00 | 1,057,152 | — | |||||||||||||||||||||||
| Excess Defined Benefit Pension Plan | 26.0 | 2,215,638 | — | Excess Defined Benefit Pension Plan | 29.00 | 3,098,010 | — | ||||||||||||||||||||||||
John J. Keane | Salaried Employees Pension Plan | 23.0 | 768,740 | — | Salaried Employees Pension Plan | 26.00 | 954,562 | — | |||||||||||||||||||||||
| Excess Defined Benefit Pension Plan | 23.0 | 2,053,600 | — | Excess Defined Benefit Pension Plan | 26.00 | 2,502,717 | — | ||||||||||||||||||||||||
Gregory P. Merk (3) | Salaried Employees Pension Plan | 2.75 | 67,101 | — | Salaried Employees Pension Plan | 5.75 | 136,045 | — | |||||||||||||||||||||||
| Excess Defined Benefit Pension Plan | 21.33 | 1,231,219 | — | Excess Defined Benefit Pension Plan | 24.33 | 1,877,719 | — | ||||||||||||||||||||||||
Douglas C. Bloomfield | Salaried Employees Pension Plan | 30.42 | 983,159 | — | |||||||||||||||||||||||||||
Jeffrey A. Pembroke | Salaried Employees Pension Plan | 13.08 | 370,767 | — | |||||||||||||||||||||||||||
| Excess Defined Benefit Pension Plan | 30.42 | 1,374,615 | — | Excess Defined Benefit Pension Plan | 13.08 | 671,756 | — | ||||||||||||||||||||||||
| (1) | For the Salaried Employees Pension Plan, the actuarial assumptions used to determine the present value of the accumulated benefit at October 31, |
measurement date of October 31;
each participant’s benefit commences at age 65, the age at which retirement may occur without anyage-based reduction in benefits, discounted to October 31, 20152018 using a discount rate of 4.05%3.57%;
the benefits are payable as a single life annuity; and
post-retirement mortality based on the RP2006 Fully Generational Mortality Table for Healthy Employees projected with mortality improvements by Scale MP2015.MP2016.
| (2) | For the Excess Defined Benefit Pension Plan, the calculation of the present value of the accumulated benefit for Messrs. Hilton, Thaxton, Keane, |
| (3) | Mr. Merk became a participant in the Salaried Employees Pension Plan and the Excess Defined Benefit Pension Plan effective February 1, 2013. He receives benefit service credit for his service prior to February 1, 2013 with Nordson under the Excess Defined Benefit Pension Plan. |
Salaried Employees Pension Plan
We sponsor the Nordson Corporation Salaried Employees Pension Plan (the “Salaried Employees Pension Plan”), a defined benefit pension plan for our U.S.-based salaried employees, including our U.S.-based named executive officers. Benefits under the pension plan are based on a “final average pay,” which means the monthly average of the highest aggregate compensation (base salary and cash incentive payment) for 60 months of the 120 most recent consecutive months prior to retirement. Compensation used to determine benefits under the Salaried Employees Pension Plan may not exceed the limit under the Internal Revenue Code.
Normal retirement age under the Salaried Employees Pension Plan is age 65. Employees who retire on or after age 55 may begin receiving their benefit immediately but experience a reduction in the benefit for every month prior to age 65 that the benefit begins. Employees become 100% vested in their benefit at the earlier of age 65, or after five years of service. The benefits are further reduced by benefits received under the Social Security program.
Nordson Corporation – | | |
If the employee dies prior to receiving the vested benefit, the surviving spouse, if any, will receive a 50% survivor annuity for the rest of the surviving spouse’s life. Benefits under the Salaried Employees Pension Plan become payable on the first of the month following retirement, absent any election by a participant to commence the payment of benefits at a different time. Benefits are payable in one of the following ways:
Life Only Annuity. If a participant is not married or has been married less than 12 months when payments begin and does not elect an optional payment method, he or she will receive the full amount of his or her benefit in equal monthly installments for the rest of his or her life. Payments begin on the first of the month following the retirement date. After death, no additional payments are made.
50% Joint & Survivor Annuity. If a participant is married for at least 12 months when payments begin, he or she will receive his or her benefit as a 50% Joint & Survivor Annuity, absent election of (and spousal consent for) an optional payment form. Under this option, a participant will receive a reduced monthly benefit during his or her lifetime. After the participant’s death, his or her spouse receives a benefit equal to 50% of the monthly benefit the participant was receiving. If the spouse dies before the participant, but after the participant begins receiving payments, the participant will continue to receive the same benefit amount during his or her lifetime and no additional payments are made after death.
100% (or 75%) Joint & Survivor Annuity. A participant will receive a reduced lifetime benefit under this option. The participant names a beneficiary and chooses the percentage of his or her benefit to continue to that individual after the participant’s death. After death, the beneficiary receives the percentage of benefit elected (100% or 75%) for the remainder of his or her life. The participant’s age at the date the benefit commences, the beneficiary’s age, and the percentage elected to continue after death affect the amount of the benefit received during the participant’s lifetime.
10 Year Certain Annuity. A participant will receive a reduced lifetime benefit in equal monthly installments with payments guaranteed for at least ten years under this option. Payments continue for the rest of the participant’s life even if he or she lives longer than the period of time elected. However, if the participant receives less than 120 payments before death, the same monthly benefit continues to the beneficiary until the combined total number of installment payments are made.
Level Income Option. This option allows a participant to receive an increased monthly payment from the pension plan initially if a participant retires early and begins receiving payments from the pension plan before he or she is eligible for Social Security benefits. After Social Security benefits begin, the monthly payment from the pension plan is reduced. This option does not provide any survivor benefit and, therefore, no benefit is payable after death.
Excess Defined Benefit Pension Plan
We also sponsor an Excess Defined Benefit Pension Plan for our U.S.-based executive officers. This plan is anon-tax qualified supplemental defined benefit plan designed to work in conjunction with the Salaried Employees Pension Plan. The pension benefit outlined above for the Salaried Employees Pension Plan is calculated as if there were no compensation limits under the Internal Revenue Code. Then, the maximum benefit allowable is paid out under the Salaried Employees Pension Plan and the balance is paid out under the Excess Defined Benefit Pension Plan. In addition to the benefit payout alternatives listed above,under the Salaried Employees Pension Plan, our executive officers may under the Excess Defined Benefit Pension Plan our executive officers may elect a lump sum payout of the benefit following termination of employment.
| 70 | | Nordson Corporation – 2019 Proxy Statement |
Benefits under the Excess Defined Benefit Pension Plan are unsecured and are payable from our general assets. Payments will be delayed if and to the extent payment within six months of the
termination of employment will result in the imposition of additional taxes on the executive officer pursuant to Section 409A of the Internal Revenue Code. Payments delayed due to Section 409A rules will accrue interest during the deferral period at the10-year Treasury bill rate in effect on the first business day of the Excess Defined Benefit Pension Plan year in which the delayed payment period commences.
NON-QUALIFIED DEFERRED COMPENSATION
The following narrative, table setsand footnotes set forth the contributions, earnings, withdrawals or distributions, and aggregate balances for the named executive officers in 20152018 under the Amended and Restated 2005 Deferred Compensation Plan.
| Deferred Compensation Plan | Deferred Compensation Plan | ||||||||||||||||||||||||||||||||||||||||||||
| Named Executive Officer | Executive Contributions in Last Fiscal Year (1) ($) | Registrant Contributions in Last Fiscal Year ($) | Aggregate Earnings in Last Fiscal Year ($) | Aggregate With- drawals / Distributions ($) | Aggregate Balance at Last Fiscal Year End (3) ($) | Executive Contributions in Last Fiscal Year (1) ($) | Registrant Contributions in Last Fiscal Year ($) | Aggregate Earnings in Last Fiscal Year (2) ($) | Aggregate Withdrawals / Distributions ($) | Aggregate Balance at Last Fiscal Year End (3) ($) | |||||||||||||||||||||||||||||||||||
Michael F. Hilton | 1,955,344 | 39,701 | (2 | ) | — | 8,101,833 | 121,622 | 59,810 | (373,063 | ) | — | 19,084,883 | |||||||||||||||||||||||||||||||||
Gregory A. Thaxton | 41,942 | 11,484 | (2 | ) | — | 2,239,709 | 245,554 | 20,334 | (6,429) | — | 5,029,027 | ||||||||||||||||||||||||||||||||||
John J. Keane | 30,000 | 9,169 | (2 | ) | — | 1,920,543 | 30,000 | 15,900 | 3,052 | — | 2,793,820 | ||||||||||||||||||||||||||||||||||
Gregory P. Merk | 165,069 | 7,702 | 11,121 | — | 329,350 | 177,777 | 16,434 | 19,698 | — | 1,102,501 | |||||||||||||||||||||||||||||||||||
Douglas C. Bloomfield | 157,881 | 7,229 | (2 | ) | — | 3,566,851 | |||||||||||||||||||||||||||||||||||||||
Jeffrey A. Pembroke | 19,936 | 10,637 | 3,420 | — | 84,427 | ||||||||||||||||||||||||||||||||||||||||
| (1) | This column includes: |
| (a) | Amounts of base salary each named executive officer deferred in |
| (b) | Amounts of Annual Cash Incentive Award payout deferred in |
| (c) | Of the |
| (2) | The increase in aggregate earnings is attributable primarily to appreciation in the |
2018.
|
| |
| ||
| ||
|
| (3) | The fiscalyear-end aggregate balances reported in this column include the amounts of base salary, |
| (a) | Base salary: Mr. Hilton – |
| (b) | Annual Cash Incentive Award |
| (c) | Settlement date dollar value of Performance Share Incentive Award |
|
Deferred Compensation Plan
Under the Amended and Restated 2005 Deferred Compensation Plan, our executive officers may elect to defer up to 100% of their base pay and Annual Cash incentiveIncentive Award payout, and 90% of their Performance Share Incentive Award payout each year. An executive officer may elect to invest in a number of investment accounts designated by the Compensation Committee, including an account comprised of units of our common shares. The cash investment accounts mirror the investment funds and investment returns provided under our qualified defined contribution 401(k) Plan, although the plans are not linked. The number of units credited to the share unit account is based on the closing price of our common shares on the day the share units are credited to the account and includes additional share units credited for quarterly dividends paid on our common shares.
Nordson Corporation – 2019 Proxy Statement | | 71 |
Distributions are made in either a lump sum or installments based upon the executive officer’s annual election. An executive officer may elect to receive payment in the form of a single lump sum or periodic payments over a period of 5, 10, or 15 years. No later than 12 months prior to a distribution, an executive officer may make an election to change the payment date or form of payment, provided that the distribution occurs at least 5 years after the original date of distribution previously elected by the executive officer.
The Internal Revenue Code places limits on amounts that “highly compensated employees,” such as our executive officers, may contribute to 401(k) plans. Correspondingly, because of these limits, matching contributions to the 401(k) Plan accounts of our executive officers in 20152018 were limited. In order to restore any matching contribution amount that may have been forgone by our executive officers because of this limitation, we provide executive officers the opportunity to capture this potentially lost match in the deferred compensation plan. This restoration match is made to the executive officers who defer at least a minimum portion of their base salary.
Upon an executive officer’s death, payment will be made to a designated beneficiary. For all distributions, cash will be paid with respect to the cash accounts and our common shares will be issued equal to the number of share units in the executive officer’s share equivalent unit account. Upon an executive officer’s death, payment of any balance in a deferral account will be made to a designated beneficiary.
In order to permit deferrals and payouts that comply with Section 409A of the Internal Revenue Code, we adopted the 2005 Deferred Compensation Plan effective for deferrals by the executive officers after January 1, 2005. On December 10, 2008, the Compensation Committee adopted the Amended and Restated 2005 Deferred Compensation Plan to bring the plan into compliance with final rules issued under Section 409A.
The investment options and respective returns under the Amended and Restated 2005 Deferred Compensation Plan for 2013, 20142016, 2017 and 20152018 were as follows:
| Investment Funds | 2013 Return % | 2014 Return % | 2015 Return % |
2018 Return
|
2017 Return
|
2016 Return
| |||||||||||||||||||||
Investment Contract | 3.00 | % | 2.58 | % | 3.00 | % |
| 3.00
| %
|
| 3.00
| %
|
| 3.05
| %
| ||||||||||||
Money Market (B) | (0.59 | %) | (0.64 | %) | (0.63 | )% | |||||||||||||||||||||
Money Market Trust
|
| 0.80
| %
|
| 0.01
| %
|
| (0.24
| )%*
| ||||||||||||||||||
Large Cap Value (500 Index B) | 26.11 | % | 16.26 | % | 4.33 | % |
| 6.41
| %
|
| 16.10
| %
|
| 3.58
| %
| ||||||||||||
Large Cap Blend (Equity-Income) | 26.61 | % | 9.23 | % | (3.09 | )% |
| 0.78
| %
|
| 11.12
| %
|
| 6.90
| %
| ||||||||||||
Large Cap Growth (Blue Chip Growth) | 35.49 | % | 14.74 | % | 11.56 | % |
| 9.77
| %
|
| 32.71
| %
|
| (0.55
| )%
| ||||||||||||
International Equity Index (B) | 19.34 | % | 0.07 | % | (6.28 | )% |
| (9.15
| )%
|
| 23.65
| %
|
| (0.05
| )%
| ||||||||||||
Nordson Stock (includes dividends) | 23.19 | % | 4.34 | % | (5.76 | )% |
| 13.82
| %
|
| 13.82
| %
|
| 41.94
| %
| ||||||||||||
| * | Average of the 2016 Return % of two funds. The Money Market fund in the plan was merged into a new fund in April 2016. |
| Nordson Corporation – |
POTENTIAL BENEFITS UPON TERMINATION
The following table and narrative address the impact a loss of employment in each of the following scenarios as of October 31, 2015 has2018 would have on executive compensation and benefits: termination for cause or voluntary termination, death, long-term disability, retirement, involuntary termination and termination without cause or for good reason, and payments in connection with a termination following achange-in-control.
Payout of account balances of our executive officers’ deferred compensation plan accounts, qualified and excess defined benefit pension plans, and qualified defined contribution (401(k))401(k) plan would be made under the distribution provisions of those plans.
No additional or enhanced payments would be made to an executive officer for termination for cause or voluntary separation.
| Benefit or Payment | Termination for Cause Voluntary | Termination Death, Disability
(age 65) | Termination Retirement | Involuntary Termination (3) / Termination | Termination following a | |||||
Severance (Cash) | None | None | None | Chief Executive Officer Only:
Described in the “Severance Agreements” section above under Part IV of Compensation Discussion and | Lump sum cash payment equal to two times the sum of the executive officer’s annual base salary and cash incentive award (at target payout) | |||||
| Stock Options (Unvested) | Forfeited | Death or Disability: full vesting (6)
Retirement at 65: vesting continues except for awards made less than 12 months prior to termination, which are forfeited (6) | Vesting Continues except for awards made less than 12 months prior to termination, which are forfeited (7) | Forfeited | Vest | |||||
Service-Based Shares (Unvested) | Forfeited | Death or Disability: full
Retirement at 65: full vesting, except for awards made less than 12 months prior to termination, which are forfeited | Pro-rated vesting based on number of months of service since award date except for awards made less than 12 months prior to termination, which are forfeited | Chief Executive Officer Only:
Full
All Others: Forfeited | Vest | |||||
| Performance Share Incentive Award | Forfeited | Pro-rated payout determined at the conclusion of the respective performance period | Pro-rated payout determined at the conclusion of the respective performance period | Forfeited | Vesting with payout based on performance at target as of the date ofchange-in-control | |||||
|
|
|
|
|
| ||||||
| Excess Defined Pension Benefit | No enhancement | No enhancement | No enhancement | No enhancement | Two (2) additional years of age and benefit service | |||||
Nordson Corporation – 2019 Proxy Statement | | 73 |
| Benefit or Payment | Termination for Cause Voluntary | Termination Death, Disability (age 65) (2) | Termination Retirement | Involuntary Termination (3) / Termination | Termination following a | |||||
| Paid Health Care Benefits | None | None | None | Chief Executive Officer:Yes
For Others: None | Yes | |||||
| Professional Outplacement Services | None | None | None | None | Yes (up to $50,000) | |||||
| Excise and Related Income Tax Gross Up | None | None | None | None | Yes (8) | |||||
| (1) | A disability benefit is payable under the long-term disability plan |
| (2) | Predicated upon retirement under the Company-sponsored pension plan. Stock option and restricted share awards made less than 12 months prior to date of termination of employment are forfeited. |
| (3) | Presumes involuntary termination was not due to a violation of the Company’s Code of Ethics and Business Conduct. |
| (4) | We have no contractual obligation to provide severance payments or benefits to an executive officer whose employment is terminated without cause, other than with respect to Mr. Hilton under his employment agreement. Severance benefits due to Mr. Hilton in the event of a termination without cause or a resignation for good reason are discussed under the caption “Severance Agreements” in the Compensation Discussion and Analysis of this Proxy Statement. |
If any negotiated severance arrangement were entered into between us and an executive officer for severance payments, we would require the executive officer to sign a general release and waiver of claims against us and would typically require compliance with confidentiality andnon-compete restrictions. Any agreed-upon severance payment will be subject to delay in the commencement of payments required by Section 409A of the Internal Revenue Code.
“Cause” and “Good Reason” are discussed in the “Severance Agreement” section of the Compensation Discussion and Analysis section of this Proxy Statement.
| (5) | Achange-in-control occurs if and when: |
a report is filed with the SEC on Schedule 13D or Schedule14D-1 (or any successor schedule, form, or report), each as promulgated pursuant to the Exchange Act, disclosing that any “person” (as the term “person” is used in Section 13(d) or Section 14(d)(2) of the Exchange Act) is or becomes a beneficial owner, directly or indirectly, of securities representing 35% or more of the combined voting power of our then outstanding securities eligible to vote for the election of the Board of Directors;
during any period of 24 consecutive months, individuals who, at the beginning of such24-month period were our directors, which we refer to as the incumbent board, cease to constitute at least a majority of the Board of Directors, unless the election, or nomination for election, of any person becoming a director subsequent to the beginning of such24-month period was approved by a vote of at leasttwo-thirds of the incumbent board;
all or substantially all of our assets are sold in a single transaction or a series of related transactions to a single purchaser or a group of affiliated purchasers; or
we are merged or consolidated with another corporation and, as a result, securities representing less than 50% of the combined voting power of the surviving or resulting corporation’s securities (or of the securities of a parent corporation in case of a merger in which the surviving or resulting corporation becomes a wholly-owned subsidiary of the parent corporation) are owned in the aggregate by holders of our securities immediately prior to such merger or consolidation.
Upon achange-in-control, all outstanding equity compensation awards vest immediately. Unlike the “double trigger” discussed above, no termination of employment is required for the accelerated vesting of the awards. This “single-trigger” vesting provides our named executive officers with the same opportunity as our shareholders to realize the value created by the transaction.
| 74 | | Nordson Corporation – 2019 Proxy Statement |
| (6) | Vested options may be exercised for the life of the option. |
| (7) | Vested options may be exercised for the earlier of |
| (8) | Effective November 1, 2015, we have eliminated gross up payments on any severance benefits for tax purposes. |
Enhanced Payments and Benefits Assuming Termination as of October 30, 201531, 2018
The following table reflects the estimated value of enhanced payments and benefits that the named executive officers would receive under various termination scenarios assuming that all listed events occurred as of the last business day of fiscal year 20152018 – October 30, 2015.31, 2018.
In estimating the amounts reflected in the following table, we also applied the following general assumptions and principles:
noNo amounts for 20152018 base salary or payouts under the 20152018 Annual Cash Incentive Award and2013-2015 2016-2018 Performance Share Incentive Award are included in the following tables because the amounts are already earned as of October 30, 201531, 2018 and are not enhanced by any of the triggering events;
amountsAmounts were calculated based on each named executive officer’s age, compensation, and years of service as of October 30, 2015;31, 2018;
theThe value of our common shares on October 30, 201531, 2018 was $71.24$122.67 per share;
unvestedUnvested stock options that vest were valued at an amount per share equal to the difference between $71.24$122.67 and the awardgrant date share price per share for each of the stock options on the date of the award;grant date;
noNo amounts were included for account balances in our qualified defined contribution 401(k) plan because this plan is available to all U.S.-based salaried employees who have worked the minimum amount of hours required to receive this benefit;
noNo amounts were included for balances in a named executive officers’ deferred compensation account. Fiscalyear-end deferred account balances are reported in theNon-Qualified Deferred Compensation table;
theThe value of benefits and payments that are generally available to all employees on anon-discriminatory basis are not included;
theThe value of performance share units for termination other than voluntary termination or termination due to cause was determined using payout at target performance;
theThe value of restricted shares subject to accelerated vesting is based on shares outstanding as of October 30, 201531, 2018 as shown in the Outstanding Equity Awards table. Value is determined by multiplying the number of shares by the closing price of our common shares on October 30, 2015;31, 2018 – $122.67 per share;
noneNone of the named executive officers is qualified to receive an age 65 retirement pension benefit as of October 30, 2015.31, 2018. The actuarial present value of the deferred vested benefit under our Salaried Employees Pension Plan for each named executive officer may be found in the Pension Benefits table; and
calculationCalculation of post-termination payout of the Excess Defined Benefit Pension Plan assumes a lump sum payout. Other assumptions used in the calculation are noted in footnote 1 to the Pension Benefits table. The payout amount in the event of a qualifying termination following achange-in-control reflects an additional two years of age and two years of service, up to a maximum age 65 and 30 years of service.
Nordson Corporation – | | |
Although the calculations are intended to provide reasonable estimates of the potential benefits, they are based on numerous assumptions and may not represent the actual amount a named executive officer would have received if termination had occurred on October 30, 2015.31, 2018.
| Death and Disability ($) | Early Retirement (Age 55) ($) | Involuntary Termination/ Termination Without Cause or for Good Reason (1) ($) | Qualifying Termination Following Change- in-Control ($) | Death and Disability ($) | Early Retirement (Age 55) (1) ($) | Involuntary Termination/ Termination Without Cause or for Good Reason (2) ($) | Qualifying in-Control ($) | |||||||||||||||||||||||||||||
Michael F. Hilton
|
| 2,160,518
|
|
| 1,339,749
|
|
| 4,371,093
|
|
| 21,214,888
|
|
|
6,734,973
|
|
|
5,961,604
|
|
|
5,507,542
|
|
|
27,790,593
|
| ||||||||||||
Gregory A. Thaxton
|
| 532,941
|
|
| 336,965
|
|
| —
|
|
| 8,275,937
|
|
|
1,652,887
|
|
|
1,463,232
|
|
|
—
|
|
|
12,010,172
|
| ||||||||||||
John J. Keane
|
| 719,818
|
|
| 357,251
|
|
| —
|
|
| 7,643,009
|
|
|
1,656,112
|
|
|
1,466,457
|
|
|
—
|
|
|
9,521,271
|
| ||||||||||||
Gregory P. Merk
|
| 395,058
|
|
| 239,408
|
|
| —
|
|
| 5,090,763
|
|
|
1,219,426
|
|
|
1,075,419
|
|
|
—
|
|
|
6,197,050
|
| ||||||||||||
Douglas C. Bloomfield
|
| 376,179
|
|
| 231,295
|
|
| —
|
|
| 4,774,993
|
| ||||||||||||||||||||||||
Jeffrey A. Pembroke
|
|
702,483
|
|
|
552,096
|
|
|
—
|
|
|
3,879,931
|
| ||||||||||||||||||||||||
| (1) | As of October 31, 2018, no named executive officer was eligible for retirement at the normal retirement age. |
| (2) | Mr. Hilton is the only named executive officer eligible to receive severance and full vesting of restricted shares in the event his employment is terminated involuntarily by the Company or by Mr. Hilton for Good Reason, as that term is defined in the employment agreement with Mr. Hilton, absent achange-in-control. No enhancements are provided to the other named executive officers in this termination scenario. |
| 76 | | Nordson Corporation – 2019 Proxy Statement |
As required by Section 953(b) of the Dodd-Frank Wall Street Reform and Consumer Protection Act of 2010 and Item 402(u) of RegulationS-K, we are providing the following information with respect to our last completed fiscal year. The pay ratio information provided below is a reasonable estimate calculated in a manner consistent with Item 402(u) of RegulationS-K.
In determining the pay ratio information provided above, we first identified our median employee for the 2018 fiscal year by using the following methodology, assumptions, adjustments, and estimates, as permitted by Item 402(u) of RegulationS-K. We selected September 1, 2018 as the date upon which we would identify our median employee, and, from our tax and payroll records, we compiled a list of all full-time and part-time employees, excluding the CEO, who were employed on that date. We did not exclude any employees located outside the United States. We used total target cash compensation (base salary and annual cash incentive) as the consistently applied compensation measure for all employees. Sorting the list based on this measure, we selected our median employee.
Once our median employee was identified in the manner described above, we calculated the annual total compensation of the median employee using the same methodology that we used to determine the annual total compensation of the CEO, as reported in the Summary Compensation Table. The annual total compensation our median employee, excluding the CEO, was $61,750. The annual total compensation of our CEO, as reported in the Summary Compensation Table on page 61 of this Proxy Statement, was $6,997,090; and the ratio of the annual total compensation of our CEO to the median of the annual total compensation of all other employees was 113.3 to 1.
The pay ratio disclosure rules of Item 402(u) of RegulationS-K provide reporting companies with flexibility in determining the methodology used to identify the median employee, in calculating the median employee’s annual total compensation and in estimating the ratio of the annual total compensation of the CEO to the median of the annual total compensation of all other employees. As such, our methodology may differ materially from the methodology used by other companies to prepare their pay ratio disclosures, which, along with differences in employee populations, geographic locations, business strategies and compensation practices, may contribute to a lack of comparability between our pay ratio and the pay ratio reported by other companies, including those within our industry.
Nordson Corporation – 2019 Proxy Statement | | 77 |
January 18, 2019
To: The Board of Directors of Nordson Corporation
The Audit Committee consists solely of independent Directors within the meaning of the Nasdaq listing standards. The Audit Committee oversees Nordson’s financial reporting process on behalf of the Board. Nordson’s independent registered public accounting firm, Ernst & Young LLP, is responsible for performing an integrated audit of Nordson’s annual consolidated financial statements and internal control over financial reporting as of the end of the year in accordance with the standards of the Public Company Accounting Oversight Board (PCAOB). The Committee operates under a written charter that specifies the Committee’s responsibilities. The full text of the Committee’s Charter is available at:www.nordson.com/en/our-company/investors/annual-reports-and-presentations. The Audit Committee members are not auditors and their functions are not intended to duplicate or to certify the activities of management and the independent registered public accounting firm.
Management has the responsibility for the financial statements and the reporting process, including the systems of internal control over financial reporting. In fulfilling its oversight responsibilities, the Committee reviewed and discussed with management the audited financial statements in the Annual Report on Form10-K for the fiscal year ended October 31, 2018, including a discussion of the quality, not just the acceptability, of the accounting principles, the reasonableness of significant judgments, and the clarity of disclosures in the financial statements.
The Committee discussed with Ernst & Young LLP, which is responsible for expressing an opinion on the conformity of those audited financial statements with U.S. generally accepted accounting principles, its judgment as to the quality, not just the acceptability, of our accounting principles and such other matters as are required to be discussed with the Committee under PCAOB Auditing Standard 1301,Communications with Audit Committees. In addition, the Committee has received and discussed with Ernst & Young LLP written disclosures regarding Ernst & Young LLP’s independence as required by PCAOB Ethics and Independence Rule 3526,Communication with Audit Committees Concerning Independence.
The Committee discussed with our internal auditor and Ernst & Young LLP the overall scope and plan for their respective audits. The Committee met with the internal and independent auditors, with and without management present, to discuss the results of their examinations, their evaluations of our internal controls, and the overall quality of our financial reporting.
In reliance on the reviews and discussions referred to above, the Committee recommended to the Board of Directors that the audited financial statements be included in the Company’s Annual Report on Form10-K for the fiscal year ended October 31, 2018 filed with the Securities and Exchange Commission. The Committee also evaluated and reappointed Ernst & Young LLP as the Company’s independent registered public accounting firm for fiscal year 2019.
This Audit Committee report shall not be deemed incorporated by reference by any general statement incorporating by reference this Proxy Statement into any filing under the Securities Act of 1933 or the Securities Exchange Act of 1934 (the “Exchange Act”), except to the extent that we specifically incorporate this information by reference, and shall not otherwise be deemed filed under the Exchange Act.
This report has been furnished by the members of the Audit Committee:
Frank M. Jaehnert, Chair
Randolph W. Carson
Arthur L. George, Jr.
Joseph P. Keithley
| 78 | | Nordson Corporation – |
QUESTIONS AND ANSWERS ABOUT THE ANNUAL MEETING AND THESE PROXY MATERIALS
Why am I receiving this Proxy Statement? You have been sent this Proxy Statement and proxy/voting instruction card(s) because you were a shareholder, or held Nordson common stock through a broker, banktrustee, or other third party, at the close of business on January 4, 2016,2, 2019, the record date for shareholders entitled to vote at the Annual Meeting. As of January 4, 2016,2, 2019, there were outstanding, excluding treasury shares which cannot be voted, 56,984,39857,609,588 common shares entitled to one vote per share upon all matters presented to the shareholders.
What is a proxy? A proxy is your legal appointment of another person to vote the shares that you own in accordance with your instructions. The person you appoint to vote your shares is also called a proxy.
On the proxy/voting instruction card, you will find the names of the persons designated by the Company to act as proxies to vote your shares at the Annual Meeting. The proxies are required to vote your shares in the manner you instruct.
Who can attend the Annual Meeting? All shareholders of record as of the close of business on January 4, 20162, 2019 may attend the meeting.
Must I inform anyone of my intent to attend the Annual Meeting?Yes. To permit your name to be registered with the Key Tower security service to gain access to the BakerHostetler LLP offices, you must inform the Company’s Secretary, Gina A. Beredo, in writing (letter ore-mail) before the Annual Meeting of your intent to attend the Annual Meeting. Ms. Beredo’ s contact information is as follows:
| • | E-mail address:gina.beredo@nordson.com |
Mailing Address: 28601 Clemens Road, Westlake, Ohio 44145.
Must I present credentials to permit access to the BakerHostetler LLP offices?Yes. You must present a form of picture identification to the security officer at the desk located on the main floor of the Key Tower. You will be provided a pass to permit access to the Key Tower elevators. You will proceed to the 20th floor offices of BakerHostetler LLP.
What if I have a disability? If you are disabled and would like to participate in the Annual Meeting, we can provide reasonable assistance. Please send any request for assistance to c/o Secretary, Nordson Corporation, 28601 Clemens Road, Westlake, Ohio 44145.
What proposals may I vote on at the Annual Meeting and how does the Board recommend I vote? The following chart explains your voting options with regard to each proposal to be voted upon at the Annual Meeting, how the Board of Directors recommends that you vote, and the vote required for that proposal to be approved.
VOTING MATTERS AND BOARD RECOMMENDATIONS | ||||||||
Proposal
|
|
|
Broker Discretionary
|
Board’s Voting
| ||||
1. Election of directors | No | FOR the election of each of the | ||||||
Nordson Corporation – 2019 Proxy Statement |
VOTING MATTERS AND BOARD RECOMMENDATIONS | ||||||||
Proposal | Voting Options | Required Vote | Broker Discretionary | Board’s Voting | ||||
2. Ratify the appointment of Ernst & Young LLP as our | FOR | |||||||
3. Advisory vote to approve compensation of named executive officers | “FOR” or “AGAINST” or “ABSTAIN” from voting. | Thisnon-binding proposal will be considered approved if more votes are cast in favor than against. | No | FOR | ||||
| (1) | This is considered to be a routine matter and, therefore, if you hold your shares in street name and do not provide voting instructions to the |
|
Will any other matters be voted on? We are not aware of any other matters on which you will be asked to vote at the Annual Meeting. If other matters are properly brought before the Annual Meeting, the proxy holders will use their discretion to vote on these matters as they may arise. Furthermore, if a nominee cannot or will not serve as director, then the proxy holders will vote for a replacement nominated by the Board. We do not expect any nominee to be unwilling to serve.
May I ask questions at the Annual Meeting? Yes. Our management will respond to shareholder questions at the end of the meeting. In order to give a greater number of shareholders the opportunity to ask questions, we may impose certain procedural requirements.
What is the difference between holding shares as a shareholder of record, a beneficial owner, or a Nordson-sponsored retirement plan participant?
| • | Shareholder of record. If Nordson shares are registered in your name with our transfer agent, Computershare, |
| • | Beneficial owner (“in street name”). If your shares are not held in your name but instead are held in a brokerage account, by a trustee, or by another nominee, then that other entity/holder is considered the shareholder of record and you are considered a beneficial owner of those shares. We sent these proxy materials to that other entity/holder, and they have been forwarded to you with a voting instruction card. As the beneficial owner, you have the right to direct your broker, trustee, or other nominee how to vote. Please refer to the information your broker, trustee, or other nominee provided to determine what voting options are available to you. |
| 80 | | Nordson Corporation – 2019 Proxy Statement |
| • | Shares held as a participant in the Nordson Corporation Employees’ Savings Trust (“401(k)”) Plan and/or Nordson Corporation Employee Stock Ownership Plan (collectively, the “Plans”). If you participate in one or both of these Plans you may have certain voting rights regarding shares of our common stock credited to your account in the Plans. You do not own these shares. They are owned by the Plan trustee, which is the same trustee for both Plans. |
The Plans provide you with voting rights based on the number of shares that were constructively invested in your Plan account as of the close of business on the record date. You may vote these shares in much the same way as shareholders of record vote their shares, but you have an earlier deadline to vote.
You may vote the amount of shares credited to your account as of the record date for the Annual Meeting by telephone, via the Internet, or by mailing your signed proxy/voting instruction card in the postage-paid envelope provided. Your vote must be received by11:59 p.m., eastern standard timeEastern Time on February 25, 2016. 21, 2019. You may vote these shares by following the instructions provided on the proxy/voting instruction card included with these materials.
By submitting your voting instructions, you will direct the Plan trustee:
How to vote the shares allocated to your account in the Plan(s);, and
How to vote a portion of the shares allocated to the accounts of other participants in the Plan(s) who have not submitted voting instructions by the deadline.
The trustee will submit one proxy to vote all shares in each of the Plans. The trustee will vote the shares of participants submitting voting instructions in accordance with their instructions and will vote the remaining shares in each of the Plans in the same proportion as the final votes of all participants who actually voted. Please note that, if you do not submit voting instructions for the shares in your account by the voting deadline, those shares will be included with the other
undirected shares and voted by the trustee as described above. Because the trustee submits one proxy to vote all shares in each of the Plans, you may not vote Plan shares in person at the Annual Meeting.
Where is Nordson Corporation common stock traded? Our common stock is traded and quoted on the NASDAQNasdaq Global Select Stock Market LLC under the symbol “NDSN.”
How many votes do I have, and can I cumulate my votes? You have one vote for everyeach share of our common stock that you own. Unless cumulative voting is invoked by a shareholder through proper notice to Nordson as described under “Proposal 1: Election of Directors Whose Terms Expire in2022-Cumulative Voting,” cumulative voting is not allowed.
How do I vote and what are the voting deadlines?
Shareholders of record and Plan participants. If you are a shareholder of record or a Plan participant, you may vote by proxy in any of the following three ways:
1.By telephone. If you reside in the United States or Canada, you may call1-800-690-6903, 24 hours a day, 7 days a week. Have your proxy/voting instruction card in hand when you call and follow the voice prompts to cast your vote.
2.Via the Internet. You may access the website atwww.proxyvote.com to cast your vote 24 hours a day, 7 days a week. With your proxy/voting instruction card in hand, follow the instructions provided to cast your vote.
3.By mail. You may mark, sign and date your proxy/voting instruction card and return it in the enclosed prepaid and addressed envelope. You do not need to mail the proxy/voting instruction card if you have voted by telephone or over the Internet.
Nordson Corporation – 2019 Proxy Statement | | 81 |
The Internet and telephone voting procedures are designed to authenticate votes cast and allow shareholders to appoint a proxy and to confirm that their actions have been properly recorded. Specific voting instructions are set forth on the accompanying proxy/voting instruction card.
If you are a shareholder of record, your deadline to cast your vote by proxy is11:59 p.m., eastern standard time,Eastern Time, on February 29, 2016. 25, 2019. You may also vote in person at the Annual Meeting.
If you are a Plan participant, your deadline to cast your vote by proxy is11:59 p.m., eastern standard time,Eastern Time, on February 25, 2016. 21, 2019.
Beneficial owners. If you are a beneficial owner, you should have receivedreceive voting instructions from the broker, trustee, or other nominee holding your shares. You should follow the instructions in the notice or voting instructions provided by your broker, trustee, or nominee in order to instruct your broker, trustee, or other nominee on how to vote your shares. The availability of telephone and Internet voting will depend on the voting process of the broker, trustee, or nominee. Shares held beneficially may be voted in person at the Annual Meeting only if you obtain a legal proxy from the broker, trustee or nominee giving you the right to vote the shares.
All owners. If you receive more than one proxy/voting instruction card, it is important that you vote all shares represented by the multiple cards. Each card represents different shares.
May I change my vote? Yes. You may change your vote or revoke your proxy any time before the voting deadline.
Shareholders of record. If you are a shareholder of record, you may revoke your vote at any time before the final vote at the Annual Meeting by:
submitting a later-dated voteproxy by telephone or via the Internet since only your latest Internet or telephone proxy received by11:59 p.m., eastern standard time,Eastern Time, on February 29, 2016 25, 2019 will be counted;
returning a later-dated, duly executed proxy card;
|
delivering a written revocation to our Corporate Secretary at 28601 Clemens Road, Westlake, Ohio 44145 before the Annual Meeting; or
attending the Annual Meeting in person and voting again.
|
Plan participants. If you are a Plan participant, you may revoke previously given voting instructions on or before11:59 p.m., eastern standard time,Eastern Time, on February 25, 2016 21, 2019 by filing either a written notice of revocation or a properly completed and signed voting instruction card bearing a later date with New York Life Investment Management,John Hancock Trust Company, LLC, the trustee for each of the Plans.
Beneficial Owners. If you are a beneficial owner of your shares, you must contact the broker, trustee, or other nominee holding your shares and follow their instructions for changing your vote.
All owners. You will not revoke a proxy merely by attending the Annual Meeting. To revoke a proxy, you must take one of the actions described above.
What will happen if I do not vote my shares?
Shareholders of record. If you are the shareholder of record and you do not vote by proxy card, by telephone, via the Internet, or in person at the Annual Meeting, your shares will not be voted at the Annual Meeting.
Beneficial owners. If you are the beneficial owner of your shares, your broker, trustee, or nominee may vote your shares only on those proposals on which it has discretion to vote. Under the rules of the Securities and Exchange Commission (the “SEC”), your broker, trustee, or nominee does not have discretion to vote your shares onnon-routine matters such as Proposals 1 and 3. Therefore, if you do not provide voting instructions to your broker, trustee, or other nominee, your broker, trustee, or other nominee may only vote your shares on Proposal 2 and any other routine matters properly presented for a vote at the Annual Meeting.
| 82 | | Nordson Corporation – 2019 Proxy Statement |
What if I do not specify how my shares are to be voted? If you are a shareholder of record and you submit a duly executed proxy, but you do not provide voting instructions, your shares will be voted as indicated in the following table:
Proposal |
Vote to be Cast | |
Proposal 1 — Election of three nominees as directors to serve for athree-year term: Lee C. Banks, Randolph W. Carson, and Victor L. Richey, Jr. | FOR ALL NOMINEES | |
Proposal 2 — | FOR | |
Proposal 3 —
| FOR |
What constitutes a quorum, and why is a quorum required? Our Regulations require a quorum of shareholders to hold our Annual Meeting. A quorum will be present when at least a majority of the outstanding shares entitled to vote are represented at the Annual Meeting either in person or by proxy. Your shares will be counted towards the quorum if you submit a proxy or vote at the Annual Meeting. Abstentions and brokernon-votes (described below) will also count towards the quorum requirement. If a quorum is not achieved, a majority of the shares present at the Annual Meeting may adjourn the meeting to a later date.
What are broker non-votes and abstentions?non-votes? A brokernon-vote occurs when a broker, trustee, or other nominee holding your shares dodoes not receive voting instructions from you as the beneficial owner of the shares by a specified date before the Annual Meeting and dodoes not have discretionary authority to vote those undirected shares on specified matters under SEC rules. The uncontested election of directors (Proposal 1) and the approval, on an advisory basis, of the compensation of our named executive
officers (Proposal 3) are considerednon-routine matters and discretionary voting on these matters is prohibited.
As a result, if you are a beneficial owner and hold your shares in street name, and do not give your broker, trustee, or other nominee instructions on how to vote your shares with respect to the election of directors or the advisory vote on named executive compensation, no votes will be cast on your behalf with respect to those proposals. The ratification of auditors (Proposal 2) is a discretionary matter, so your broker, trustee, or other nominee will be permitted to exercise discretionary authority to vote your shares with respect to the ratification of our selection of Ernst & Young LLP as our independent registered public accounting firm even if you do not give your broker, trustee, or other nominee instructions on how to vote your shares with respect to that proposal.
Brokernon-votes will be counted for purposes of calculating whether a quorum is present at the Annual Meeting, but will not be counted for purposes of determining the number of votes with respect to a particular proposal. Thus, a brokernon-vote will not impact our ability to obtain a quorum and will not otherwise affect the outcome of the vote on a proposal that requires a plurality of votes cast (Proposal 1) or the approval of Proposal 2 since brokers have discretion to vote uninstructed shares on that proposal. Brokernon-votes will affecthave no effect on the outcome of the vote on ProposalProposals 2 or 3. It is important that you provide voting instructions for all shares you own beneficially.
Abstentions as to any matter are counted in determining the presence of a quorum at the Annual Meeting, and are not included in the vote count for election of directors. However, abstentions will affect the outcome of the vote on Proposals 2 and 3.
Who will tabulate the votes? Broadridge Financial Solutions, Inc. (“Broadridge”) has been engaged as our independent agent to receive and tabulate shareholder votes. Broadridge will separately tabulate FOR, AGAINST and WITHHOLD votes, abstentions, and brokernon-votes. The Inspector of Election will certify the election results and perform any other acts required by Ohio Corporation Law.
What happens if the Annual Meeting is adjourned or postponed? Your proxy will still be effective and will be voted at the rescheduled Annual Meeting. You will still be able to change or revoke your proxy until it is voted.
Nordson Corporation – 2019 Proxy Statement | | 83 |
Who is paying for the costs of this proxy solicitation? We will bear the expense of soliciting proxies. Proxies may also be solicited by Nordson personnel who will not receive additional compensation for such solicitation. Copies of proxy materials and the Annual Report to Shareholders will be supplied to brokers, trustees, and other nominees for the purpose of soliciting proxies from beneficial owners.
How will I know the results of the Annual Meeting? The final voting results will be tallied by our Inspector of Election and published in a Current Report on Form8-K filed with the SEC that we expect to file within four business days after the Annual Meeting.
If there is more than one shareholder living at the same address, will each shareholder receive proxy materials?To reduce the expense of delivering duplicate materials to shareholders sharing the same address, we have adopted a procedure approved by the SEC called “householding.” Under this procedure, certain shareholders of record who have the same address and last name will receive only one copy of the Annual Report to Shareholders and proxy materials until such time as one or more of these shareholders notifies us that they wish to receive individual copies.copies by contacting us at the address and phone number below. Shareholders of record in the same household continue to receive separate proxy/voting instruction cards. In addition, if your household currently receives multiple copies of our Annual Report to Shareholders and proxy materials, you may “opt in” to householding for future mailings to receive a single copy of these documents.
We will mail materials that you request at no cost. You may contact us with your request by writing to or calling Corporate Communications, Nordson Corporation, 28601 Clemens Road, Westlake, Ohio, 44145 or440-414-5606. You may also access the Proxy Statement and Annual Report at:www.nordson.com/en/our-company/corporate-governanceinvestors/annual-reports-and-presentations..
|
How do I submit director nominations or shareholder proposals for the 20172020 Annual Meeting?
Shareholder Proposals Submitted Under Rule14a-8
Assuming that our 20172020 Annual Meeting is held within thirty days of the anniversary of the 20162019 Annual Meeting, any shareholder who wishes to submit a proposal for consideration at the 20172020 Annual Meeting and for inclusion in next year’s Proxy Statement under Rule14a-8 of the Securities Exchange Act of 1934, as amended, (the “Exchange Act”), should send the proposal to c/o Secretary, Nordson Corporation, 28601 Clemens Road, Westlake, Ohio 44145 for receipt on or before October 1, 2016.September 20, 2019.
Proposals and Director Nominations Submitted Pursuant to our Regulations
Additionally, under our Regulations, a shareholder may submit a proposal for consideration at the 20172020 Annual Meeting, but not for inclusion in next year’s Proxy Statement, if the shareholder provides written notice no earlier than 90 days and no later than 60 days prior to the 20162020 Annual Meeting. Assuming that the 20172020 Annual Meeting will be held on February 28, 2017,25, 2020, that means notice of such proposals must be received no earlier than November 30, 201627, 2019 and no later than December 30, 2016.27, 2019. Our Regulations are available at:www.nordson.com/en/our-company/corporate-governance.
Similar to the timeliness requirements under our Regulations described above, the notice of the nomination of a director must be received no earlier than 90 days and no later than 60 days prior to our annual meeting. Assuming the 20172020 Annual Meeting is held on February 28, 2017,25, 2020, the deadlines would be no earlier than November 30, 201627, 2019 and no later than December 30, 2016.27, 2019. The Governance and Nominating Committee will assess the qualifications of the candidate according to criteria set out in Nordson Corporation’s Governance Guidelines, which are available at:www.nordson.com/en/our-company/corporate-governance. For a candidate to be considered for election as a director or for business to be properly requested by a shareholder to be brought before an annual meeting of shareholders, the shareholder must comply with all of the requirements of our Regulations, not just the timeliness requirements described above. Any proposal for inclusion in the proxy materials, notice of
| 84 | | Nordson Corporation – 2019 Proxy Statement |
proposal, or suggestion for nominee(s) for election to our Board of Directors should be sent to c/o Secretary, Nordson Corporation, 28601 Clemens Road, Westlake, Ohio 44145.
If the notices delivered pursuant to the Regulations are not timely received, then we will not be required to present such proposals or nominations, as applicable, at the 20172020 Annual Meeting. If the Board chooses to present any information submitted after the deadlines set forth in the Regulations (other than pursuant to Rule14a-8 of the Exchange Act) at the 20172020 Annual Meeting, then the persons named in proxies solicited by the Board for the 20172020 Annual Meeting may exercise discretionary voting power with respect to such information.
What is our policy governing communication with our Board of Directors?
Members of our management team regularly meet with shareholders to discuss a broad range of topics, including our governance and compensation practices. In addition, our Board provides to every shareholder the ability to communicate with the Board as a whole and with individual directors through an established process for shareholder communication.
Shareholders may communicate with the Board, the ChairmanChair of the Board, a Board committee, thenon-employee directors as a group, or individual directors by sending written communications addressed to the Board of Directors, a Board committee or such individual director or directors, c/o Secretary, Nordson Corporation, 28601 Clemens Road, Westlake, Ohio 44145.
Each communication should specify the applicable addressee or addressees to be contacted as well as the general topic of the communication. Our Secretary will initially review communications before forwarding them to members of the Board to whom the communication is directed, or if the communication is not directed to any specific member(s) of the Board, to the ChairpersonChair of the Governance and Nominating Committee. We generally will not forward a shareholder communication
that is primarily commercial in nature, relates to an improper or irrelevant topic, or requests general information about the Company. Concerns about accounting or auditing matters or possible violations of our Code of Ethics and Business Conduct should be reported pursuant to the procedures outlined in the Code.
YOUR VOTE IS VERY IMPORTANT, SO PLEASE VOTE.
Promptly return your proxy/voting instruction card or vote via telephone or the Internet, which will help to reduce the cost of this solicitation. |
This Proxy Statement and the enclosed proxy/voting instruction card are being mailed to shareholders of record on or about January 29, 2016.18, 2019. Nordson’s executive offices are located at 28601 Clemens Road, Westlake, Ohio 44145, telephone number(440) 892-1580.
Nordson Corporation – | | |
AUDIT COMMITTEE REPORT
January 29, 2016
To: The Board of Directors of Nordson Corporation
The Audit Committee has reviewed and discussed with management the audited financial statements of the Company for the year ended October 31, 2015 (the “Audited Financial Statements”). In addition, we have discussed with Ernst & Young LLP (“EY”), the principal independent registered public accounting firm for the Company, the matters required by Auditing Standard No. 16, as adopted by the Public Accounting Oversight Board.
The Committee also has received the written disclosures and the letter from EY required by the Public Company Accounting Oversight Board regarding the independent accountant’s communications with the Audit Committee concerning independence. We have confirmed with EY its independence from management and the Company, including the compatibility of non-audit services with EY’s independence.
Based on the foregoing review and discussions and relying thereon, we have recommended to our Board of Directors the inclusion of the Audited Financial Statements in our Annual Report on Form10-K for the year ended October 31, 2015.
This Audit Committee report shall not be deemed incorporated by reference by any general statement incorporating by reference this Proxy Statement into any filing under the Securities Act of 1933 or the Securities Exchange Act of 1934 (the “Exchange Act”), except to the extent that we specifically incorporate this information by reference, and shall not otherwise be deemed filed under the Exchange Act.
This report has been furnished by the members of the Audit Committee:
Michael J. Merriman, Jr., Chairman
Randolph W. Carson
Arthur L. George, Jr.
Frank M. Jaehnert
YOUR VOTE IS IMPORTANT. PLEASE VOTE YOUR PROXY ACCORDING TO THE INSTRUCTIONS ON THE PROXY/VOTING INSTRUCTION |
NORDSON CORPORATION 28601 CLEMENS ROAD WESTLAKE, OH 44145-1119 | VOTE BY INTERNET -www.proxyvote.com
Use the Internet to transmit your voting instructions and for electronic delivery of information up until 11:59 P.M.
ELECTRONIC DELIVERY OF FUTURE PROXY MATERIALS
If you would like to reduce the costs incurred by our company in mailing proxy materials, you may consent to receiving all future proxy statements, proxy cards and annual reports electronically via e-mail or the Internet. To sign up for electronic delivery, please follow the instructions above to vote using the Internet and, when prompted, indicate that you agree to receive or access proxy materials electronically in future years.
VOTE BY PHONE -1-800-690-6903
Use any touch-tone telephone to transmit your voting instructions up until11:59 P.M.
VOTE BY MAIL
Mark, sign and date your proxy card and return it in the postage-paid envelope we have provided or return it to Vote Processing, c/o Broadridge, 51 Mercedes Way, Edgewood, NY 11717. If you vote by mail, your proxy card must be received no later than 11:59 P.M. |
TO VOTE, MARK BLOCKS BELOW IN BLUE OR BLACK INK AS FOLLOWS: | ||
E54397-P16269-Z73728
| KEEP THIS PORTION FOR YOUR RECORDS |
DETACH AND RETURN THIS PORTION ONLY
THIS PROXY CARD IS VALID ONLY WHEN SIGNED AND DATED.
NORDSON CORPORATION | 1. The election of three nominees as directors to serve for a three year term. Board recommendation: FOR all 3 Nordson nominees | For All ☐ | Withhold All ☐ | For All Except ☐ | INSTRUCTIONS: To withhold authority to vote for any individual nominee(s), mark the box “FOR ALL EXCEPT” and write the | ||||||||||||||||||||||||||
| |||||||||||||||||||||||||||||||
01) Lee C. Banks 02) Randolph W. Carson 03) Victor L. Richey, Jr. | |||||||||||||||||||||||||||||||
| For | Against | Abstain | |||||||||||||||||||||||||||||
| To ratify the appointment of Ernst & Young LLP as | |||||||||||||||||||||||||||||||
| Advisory vote to approve | |||||||||||||||||||||||||||||||
| NOTE:Such other business as may properly come before the | |||||||||||||||||||||||||||||||
Please sign exactly as your name(s) appear(s) hereon. When signing as attorney, executor, administrator, or other fiduciary, please give full title as such. Joint owners should each sign personally. All holders must sign. If a corporation or partnership, please sign in full corporate or partnership name by authorized officer.
| |||||||||||||||||||||||||||||||
Signature [PLEASE SIGN WITHIN BOX] | Date
| Signature (Joint Owners)
| Date
| |||||||||
Important Notice Regarding the Availability of Proxy Materials for the Annual Meeting:
The Notice and Proxy Statement and Annual Report and Shareholder Letter are available at www.proxyvote.com.
|
NORDSON CORPORATION
Annual Meeting of Shareholders
March 1, 2016February 26, 2019
This proxy is solicited on behalf of the Board of Directors
The herein signed shareholder hereby appoints Joseph P. Keithley, Michael J. Merriman, Jr., and Mary G. Puma, or any of them, as proxies, each with the full power to appoint a substitute, to attend the 20162019 Annual Meeting of Shareholders of the Company (the “Annual Meeting”) to be held at Squire Patton Boggs (US)Baker & Hostetler LLP, 4900 Key Tower, 127 Public Square, Suite 2000, Cleveland, Ohio 44114, at 8:00 a.m.A.M., eastern standard time,Eastern Time, on March 1, 2016,February 26, 2019, and any adjournment or postponement, thereof, to cast all votes that the shareholder or Plan Participant is entitled to vote at such Annual Meeting, as designated on the reverse side of this ballot, and otherwise to represent the shareholder with all of the powers possessed by the shareholder if personally present at the Annual Meeting. The shareholder hereby acknowledges receipt of the Notice of the Annual Meeting and the accompanying Proxy Statement, the terms of each of which are incorporated by reference, and revokes any proxy heretofore given with respect to the Annual Meeting.
This proxy, when properly executed, will be voted in the manner directed herein. If no such direction is made, this proxy will be voted in accordance with the Board of Directors’ recommendations. If cumulative voting is invoked, by a shareholder through proper notice to Nordson Corporation, this proxy will give the proxy holders authority, in their discretion, to cumulate all votes to which the shareholder is entitled with respect to the shares represented by this proxy and allocate them in favor of one or more of the nominees for director if any situation arises, which in the opinion of the proxy holders, makes such action necessary or desirable.
In order to ensure that your securities are voted as you wish, if you are a shareholder of record, the proxy must be voted by 11:59 P.M., eastern standard time,Eastern Time, on February 29, 2016.25, 2019.
IMPORTANT NOTICE TO PARTICIPANTS IN THE EMPLOYEES’ SAVINGS TRUST PLAN AND EMPLOYEE STOCK OWNERSHIP PLAN (COLLECTIVELY,THE “PLANS”). |
John Hancock Trust Company, LLC, as Trustee of the Plans, has been requested to forward to you the enclosed proxy material relative to the securities held by us in your account but not registered in your name. Such securities can be voted only by us as holder of record. We shall be pleased to vote your securities in accordance with your wishes if you will execute this form and return it to us promptly in the enclosed business reply envelope. It is understood that, if you sign without otherwise marking the form, the securities will be voted as recommended by the Board of Directors on all matters to be considered at the meeting. |
For this meeting, the extent of our authority to vote your securities in the absence of your instructions, as directed by the Plans, is that securities for which no voting instructions have been given shall be voted in the same ratio as the ratio in which the total shares with respect to which timely directions were received were voted in such matters.In order to ensure that your securities are voted as you wish, the proxy must bevoted by 11:59 P.M.,
|
Continued and to be signed on reverse side
